Fundamental current account concepts
The current account balance is defined as the sum of the trade, net income and unilateral transfers balances:
CA = (X-M)+NFI+UT
where CA is the current account, X is exports, M is imports, NFI is net foreign income (essentially the net ‘returns' paid to foreigners' investments in the home country) and UT is unilateral transfers (such as aid to foreign Governments and remittances by immigrants to their former home countries). The current account balance can also be described as the difference between the acquisition of foreign assets by domestic parties and the acquisition of domestic assets by foreigners. Note that in order to run a CAD, it is necessary to run a capital account surplus of the same magnitude (in the absence of currency intervention):
KA = FDI+PI+OI+R
where KA is the capital account, FDI is net foreign direct investment, PI is net portfolio investment, OI is other net investment and R is the change in foreign exchange reserves.
Thinking about it from a different perspective, a CA that is in deficit reflects a situation where domestic investment exceeds domestic saving, and the shortfall is financed by foreign investment:
KA = I-S
where I and S are domestic investment and savings, respectively. While this relationship appears relatively simple at first glance, it encapsulates the complexity of the current account as a figure reflective of underlying macroeconomic trends (and determinants of both investment and savings behaviour), as opposed to a variable that can be controlled in a direct way. The relationship between domestic saving and investment opportunities also determines the extent to which foreign capital will flow into a country (FDI and portfolio investment), in the absence of policy intervention. The trade balance (X-M) and the net income balance (NFI+UT) are effectively the ‘balancing items' when considered from this perspective.
Looked at this way, efforts to reduce a CAD as an explicit goal may constrain the development of productive projects – and harm the long run growth potential of an economy. For example, policies that distort consumption or production decisions mean that aggregate national savings are being diverted to less productive endeavours, compared to what might have otherwise occurred. Similarly, limiting restrictions to capital flows in a country will optimise investment into a country – both foreign and domestic.
Generally speaking, a CAD itself is merely reflective of the economy-wide set of investment and consumption possibilities and is not inherently problematic. When viewed in this light, the issue of the ‘sustainability' of the CAD is moot – as long as it is the result of productive consumption and investment decisions then, in aggregate, the external position ought to be ‘sustainable'. Indeed, it is the case that, either through exchange rate adjustment or other means, the external accounts will balance and solvency would be preserved even if the adjustments are economically painful.
Obviously, there are situations where balancing of the external accounts in this way is not desirable and would have severe consequences for the macro-economy. These are the situations that Indonesia is seeking to avoid – and is managing through currency stabilisation. But market perceptions about sustainability inevitably influence the stability of the external position. This highlights the importance of the ‘stability' of the external position — which is determined by perceptions of risk.4 Risks can be exogenous to the economy, such as oil price shocks, or changes in foreign monetary policy. For the most part, there is little that can be done to guard against a sudden reversal of capital flows stemming from exogenously determined factors. However, risks can also be endogenous to the economy, with policy decisions having a potentially significant bearing on the country-specific risks of investing in a country – in turn making the task of currency stabilisation inherently more difficult. Reducing these risks contributes to the stability of the external position.
The basic makeup of Indonesia's CAD
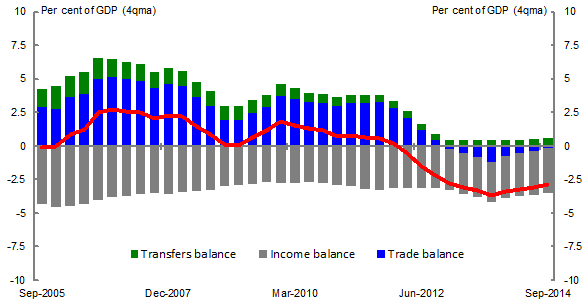
There are two main developments relevant to the recent widening of Indonesia's CAD – the export performance of its mining and manufacturing industries, and the offsetting effects of energy imports and other inputs into production. Though these developments have driven Indonesia's trade balance into deficit recently (Chart 1), the underlying drivers of Indonesia's CAD are structural in nature – and not the result of a temporary ‘gap' that can be quickly and easily filled. As such, Indonesia's CAD is likely to persist beyond the range of short-term macroeconomic management tools and the CAD should therefore not be continually targeted by short-term measures.
The main driver of the initial widening of the CAD in 2012 was a significant deterioration in Indonesia's terms of trade. Highly dependent on commodity exports (around 60 per cent of total exports), Indonesia's CAD is particularly vulnerable to swings in international commodity prices. Prices for key exports such as coal, rubber and palm oil began falling in 2012 following weakening global demand, especially from China, and have continued to weigh on export earnings through 2014.
Until the second half of 2014, the deterioration of export prices was exacerbated by persistently elevated fuel prices, of which Indonesia is a net importer. With fuels accounting for almost 10 per cent of ‘raw material' inputs into production, this has hampered the ability of the manufactured exports to capitalise on currency depreciation and offset reduced commodity export earnings. In short, rising input costs to manufacturing production have eroded the ability of the sector to generate trade returns. Exacerbating this effect is the fact that around half of Indonesia's consumption goods imports have been fuels - encouraged by generous fuel subsidies.5 In the first half of 2014, the deteriorating terms of trade was accompanied by a fall in export volumes of unprocessed ores as the minerals export ban came into effect. Late 2014 and early 2015 has seen the new administration in Indonesia introduce welcome reforms that completely overhaul fuel subsidy arrangements. Indonesians now pay the market price for gasoline as the subsidy has been removed. Gasoline accounts for about 65 per cent of the total fuel subsidies. For diesel, the Government has moved from a capped price (and associated risks to budget) to a fixed subsidy arrangement of Indonesian 1,000 Rupiah per litre.
Finally, Indonesia has a persistent services trade deficit (which is driven primarily by transportation and business services deficits). It is important to note that these factors are endemic to the present structure of Indonesia's economy – the far-reaching effects of the commodity cycle on Indonesia's economy, and deficits in tertiary industry trade (to be expected in a rapidly developing economy) suggesting that Indonesia's CAD is inherently structural, at least for foreseeable future.
Chart 1: Breakdown of Indonesia's current account balance

Source: Statistics Indonesia.
Data for the net income deficit (the NID) in Indonesia reflect the net income flows out of Indonesia that are the returns paid on domestic investment, offset by returns made on Indonesians' investments overseas. This confirms that the shift into CAD that Indonesia is currently experiencing is r
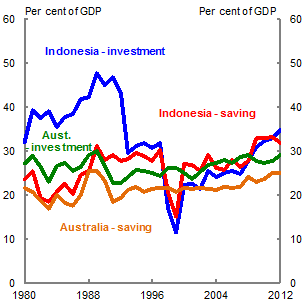
elated to the trade balance – with the returns paid on investments in Indonesia largely unchanged over the duration of Indonesia's recent CAD. For the first time after 50 years, Indonesia's (goods) trade balance has been back to deficit since 2012. Even so, as much as the commodity-driven shortfall in the trade balance is an obvious cause of the current CAD, it should not be forgotten that investment opportunities in Indonesia are now necessarily exceeding the capacity of domestic savings to finance them (Chart 2), and represent the aggregate consumption and investment decisions of individuals. This is an experience familiar to Australia, which has seen investment as a share of GDP exceed saving for a considerable period of time.
The makeup of Indonesia's capital account
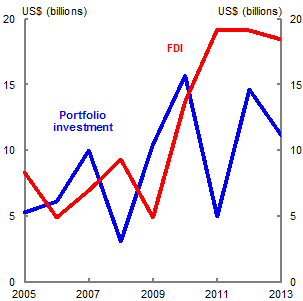
The capital account data available for investment in Indonesia indicate that, generally, Indonesia attracts more foreign direct investment relative to portfolio investment than its ASEAN peers, as a result of the run-up in FDI flows into Indonesia in recent years (Chart 3).
That said, while Indonesia is the third-largest destination for FDI in the ASEAN region, when the relative size of its economy is taken into account, its FDI flows are comparatively low (Chart 5). Over the past five years, Indonesia's communications industry, mining industry, pharmaceuticals and machinery manufacturing industries, and electricity, gas and water provision have attracted an average of almost 60 per cent of total foreign investment (both FDI and portfolio investment, Chart 6). The next five largest industries attracted an average of an additional 26 per cent of total foreign investment over the past five years. Turning to portfolio flows, around 57 per cent of portfolio flows into Indonesia are in the form of equity investments, while the remaining 43 per cent are invested into Indonesian debt securities. Of Indonesia's debt securities, most foreign portfolio investment flows into government bonds (around89 per cent of all debt securities investment), with almost all of the remainder of debt security investment seemingly invested into corporate bonds. Indonesia's equity securities are similarly distributed, with around 70 per cent of portfolio equity investment destined for corporate equities, while banks attract the remainder.
Chart 2: Gross investment and gross savings as a share of GDP

Source: IMF April 2014 World Economic Outlook database.
Chart 3: Indonesian net FDI and portfolio investment

Source: Statistics Indonesia.
It is difficult to determine the true extent to which portfolio investment flows into Indonesian debt securities are reflective of wider financing patterns in Indonesia. Nonetheless, the primary destination for credit in the wider Indonesian economy has been retail businesses, manufacturing, dwelling investment, personal credit and the forestry industry — which have collectively accounted for almost 60 per cent of financing over the past five years (Chart 7). That said, Indonesia's financial markets are relatively shallow, which exacerbates its vulnerability to exchange rate fluctuations. Additionally, given the constrained financial system, many businesses in Indonesia will seek foreign financing directly, rather than intermediated finance through the banking system – which is often unhedged, creating further risks from currency volatility.
4 Note that this is the distinction between a ‘sustainable' CAD, and a particular level of the CAD being sustained.
5 Admittedly, Indonesia's consumption goods imports are reasonably low, averaging around 13 per cent of total goods and services imports over the past five years.