Martin Gould1
A key challenge for developing countries endowed with natural resources is to transform those resources into sustained improvements in living standards. A number of Pacific island countries have utilised sovereign wealth funds (SWFs) to manage government revenue from exhaustible natural resources with the aim of improving development outcomes. Experience in the region has been mixed — some SWFs have aided intergenerational equity and macroeconomic stability while others have struggled to bring about improvements in wellbeing.
This paper examines the past and present SWFs of Kiribati, Nauru, Timor–Leste and Papua New Guinea. In doing so, it draws out some lessons for policymakers considering the use of SWFs in managing resource revenue in developing countries. Principles for successful SWFs are identified, including strong transparency, public support for the SWF, integration with the national budget and professional investment management.
Introduction
On 8 December 2009, at a ceremony in the Papua New Guinea (PNG) capital Port Moresby, PNG LNG joint venture partners publically agreed to proceed with a US$18.3 billion commercialisation of gas reserves in the Highlands region. This will be the largest resource project in PNG history and is likely to boost government revenue substantially. East of PNG, in Solomon Islands, around 15 companies are exploring the country’s gold, copper and nickel deposits, although substantial revenue from mining is still some years away. Timor–Leste,2 on the other hand, is already receiving significant revenue from oil and gas production. In 2009, tax and royalties from hydrocarbons financed around 90 per cent of the central government’s budget, making Timor–Leste one of the most oil dependent countries in the world (IMF 2009c). And throughout the Pacific, numerous countries may allow seabed mining over the coming years as technology advances.
While the revenue flows from such projects present important opportunities to improve living standards, fully capitalising on natural resource extraction in developing countries is challenging. In the Pacific, a number of countries have established sovereign wealth funds (SWFs) to manage resource revenue in the hope of converting natural resource wealth into improved wellbeing.
This article will examine these SWFs and draw out lessons for policymakers considering resource revenue management in the Pacific. It begins by examining the policy challenges posed by natural resource extraction, many of which SWF arrangements aim to mitigate. The next section classifies the different types of SWFs, with a focus on natural resource funds. The past and present SWFs of Kiribati, Nauru, Timor-Leste and PNG are then analysed, the diverse outcomes providing lessons for policymakers. The article ends by advancing some policy principles for the use of SWFs in the Pacific.
The potential consequences of exhaustible natural resource extraction in developing countries
Perhaps paradoxically, developing countries with abundant non–renewable natural resources like minerals and hydrocarbons, on average have lower rates of economic growth and worse development outcomes than those without (Sachs and Warner 1995, Mehlum et al. 2006 and van der Ploeg 2007). While mining and oil production should provide much needed income and foreign investment to capital scarce economies, often the negative externalities of such projects mean the net effect on development is deleterious (Collier 2007).3
The term ‘resource curse’ is often used to group a number of impediments to economic development that are associated with natural resource extraction in developing countries.
First, large revenue flows to the central government from resource projects often weaken the links between citizens and their state. When governments can rely on one sector or a limited number of projects to supply a large portion of its revenue, the incentive to promote broad wealth creation, which can then be taxed, is reduced. Moreover, when citizens are lightly taxed their incentive to hold governments accountable is diminished (OECD 2008). Empirically, there is a strong correlation between poor governance and natural resource wealth in developing countries (Ades and Di Tella 1999).
Second, depending on the structure of the economy, the extraction and export of natural resources can cause the local currency to appreciate, making other export sectors less competitive. Compounding this, input prices rise as resource companies and the non–traded sector (which benefits from the spending of higher incomes in the local economy) bid up the price of wages and property (Corden 1984). This effect, commonly called ‘Dutch Disease’,4 is a predictable response to changes in the local economy — exchange rate changes help move factors in the economy to their most productive use.
Dutch Disease can be a challenge for developing countries however, as non–resource exports are often conducive to broad based economic growth. Agriculture, services and manufacturing, as opposed to resource extraction, are relatively labour intensive and thus draw more people into the formal economy. Dutch Disease can interrupt this process and can be particularly harmful if the internal reallocation of production factors is temporary — commodity prices fluctuate, mineral projects end and oil wells dry up. The combination of a weakly developed private sector, rigid or incomplete markets and low human capital often mean displaced labour is unable to secure other opportunities, making reallocation costly. Limited social safety nets can also mean assistance with the transition is not provided.
Third, the volatility of commodity prices can impair the ability of resource revenue dependent governments to plan expenditure over the medium term. Commodity price fluctuations can also expose economies with large resource sectors to painful shocks that institutions in developing countries often struggle to respond to effectively.
Fourth, sudden, substantial, unevenly distributed increases in wealth can fuel internal grievances, leading to violent conflict over royalties, or sustain pre–existing conflicts (Hodler 2006). Finally, negative environmental effects of natural resource extraction, if not properly mitigated, can damage other industries such as agriculture.
Despite the seriousness of these challenges some countries have harnessed resource riches to lift long–term economic growth. One method often advanced to counter many of the potential negative consequences of natural resource extraction in developing countries, particularly weakened accountability, Dutch Disease and revenue volatility, is to save revenue in a SWF.
Classifying SWFs
‘Sovereign wealth fund’ is a broad term used to describe a special purpose government–owned fund that manages and/or invests government savings, usually separate from the state’s budget (Devlin and Brummitt 2007).5 SWFs have increased in popularity over the last 30 years with some estimates putting the total asset holdings of SWFs between US$3.9 trillion and US$5.3 trillion (Truman 2008, IFSL 2009).
This paper will focus on SWFs funded by revenue from natural resource extraction. Commonly called non–renewable resource funds (NRFs), they account for around 70 per cent of SWFs. SWFs funded by ‘surplus’ foreign exchange reserves, the proceeds of privatisation, development assistance and/or general fiscal surpluses account for the remaining 30 per cent (Truman 2008 and IFSL 2009).
NRFs can be divided into two broad categories: stabilisation funds and saving funds (Davis et al. 2001). Although most NRFs
play both a stabilisation and saving role, this categorisation reflects the fact that the majority of funds prioritise one function over the other.
The primary aim of stabilisation funds is to reduce the impact of resource revenue volatility (normally due to commodity price volatility) on the government’s budget. The increase in fiscal stability can also simplify the operation of monetary policy.
When commodity prices or resource revenues are ‘high’, flows into the stabilisation fund increase and when mineral revenues are ‘low’, the fund is drawn down. Ideally, the uncertainty and volatility of resource revenue is transferred to the fund, allowing budgetary spending to be insulated from commodity price fluctuations.
A number of strategies or rules can be employed to govern the operation of stabilisation funds. The fund may receive inflows when prices or revenue exceed a reference value, which may be fixed or calculated on the basis of future price forecasts. The fund may make transfers to the budget when revenue or prices fall below the reference price. The required accumulation and permissible depletion may also be dependent on the size of the fund at the time. Rules governing maximum or minimum balances may also apply.
In the Pacific, PNG’s now defunct Mineral Resources Stabilisation Fund can be characterised as a stabilisation fund and the current commodity revenue trust funds also have stabilisation objectives. Their operation is outlined below.
The main goal of saving funds is to set aside resource revenue for future consumption or investment. As minerals and hydrocarbons are exhaustible resources, saving funds can enable future generations to benefit from the extraction, by converting finite revenue into a long–term financial flow. This is particularly important when natural endowments are limited or of a one–off nature.
The manner in which revenue is saved and then transferred to the budget differs across funds. Flows into saving funds may be based on a prescribed share of resource revenue or of total revenue. Other funds rely on a yearly, fixed nominal contribution or voluntary contributions from government in years of fiscal surplus. Conversely, all resource revenue may flow into the fund, before a portion is transferred to the state’s budget.
Similarly when it comes to expenditure, saving funds can have different rules. Yearly withdrawals may be a nominal amount or a portion of the fund’s current and/or future value (the latter relying on price and production forecasts). Conversely, the fund may simply finance any budget shortfall. Guidelines can be directed at short-term stabilisation objectives by allowing withdrawals to cover revenue downturns, recessions or natural disasters (Davis et al. 2001).
In the Pacific region, saving funds are found in Timor–Leste and Kiribati. In the past, Nauru also employed a saving fund.
The Kiribati Revenue Equalisation Reserve Fund
Kiribati, a nation of atolls and one island spread over a stretch of the Pacific Ocean about the size of Western Europe, has a population of around 100,000. The economy is dominated by the public sector which provides two thirds of all paid employment. Output is hampered by the country’s remoteness and lack of fertile land, although income per capita is boosted by remittances and fishing licence fees. The local currency is the Australian dollar.
Phosphate mining began on Banaba Island around 1900 after Kiribati was colonised by Britain. In 1956, the colonial administration established the Revenue Equalisation Reserve Fund (RERF). The Fund received revenue from phosphate mining royalties until phosphate deposits were exhausted in 1979 (ADB 2008).
The Government of Kiribati, as both the trustee and beneficiary, has complete control over the RERF. The Reserve Fund Committee, chaired by the Minister of Finance and staffed by public servants, has management responsibility for the Fund. The RERF is held offshore and is currently split 70:30 between bonds and equities. Exchange rate risk is reduced by investments in more than 20 currencies, including the US dollar, the Japanese yen and the euro (IMF 2009a).
The Kiribati budget and the RERF are fully integrated — fiscal surpluses are added to the fund and any budget shortfalls are financed via drawdowns. While there are no rules on withdrawal limits, in 1996 Parliament agreed in principle to hold the real per capita value of the RERF constant (then A$4,700).
Since independence in 1979, Kiribati has generally maintained a culture of strong fiscal management (ADB 2008). During periods of solid economic growth, the fiscal position generally improves, and windfall revenue is normally saved. As a result the value of the RERF has grown to A$560 million in 2008 (Chart 1).
Withdrawals from the fund were minimal between 1980 and 2000 (IMF 2009a). Returns were generally reinvested and the RERF benefited significantly as equity prices climbed in the 1990s. The Fund rose more than 40 per cent in real terms between 1996 and 2000.
This century, fiscal management has been more mixed. Significant withdrawals from the RERF began in 2004 and averaged A$30 million (20 per cent of GDP) annually to 2008. The seeds for such large drawdowns were sown in the 1990s when temporary revenue increases from fishing licences were used to grow the public service and increase subsidies to public enterprises. As domestic revenue has fallen, the Government has increased withdrawals from the RERF (IMF 2009a).
Chart 1: RERF balance and withdrawals(a)
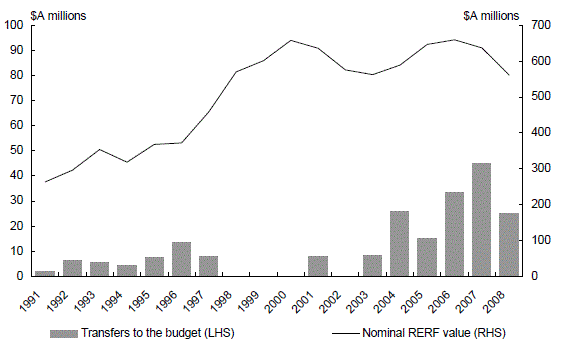
(a) Detailed data before 1991 could not be obtained. Source: Graham 2005, ADB 2008 and IMF 2009a.
Increased drawdowns and equity market falls, combined with significant domestic inflation due to high international food and fuel prices in 2008, have reduced the real per capita value of the RERF. After peaking at more than A$7000 (in 1996 dollars) in 2000, the real per capita value has fallen to around A$4000 (Chart 2). While management of the fund has, on the whole, been strong, the IMF projects that if the trend over the last five years persists the RERF will be depleted by 2030 (IMF 2009a).
Chart 2: Real per capita value of the RERF (1996 $A) and inflation
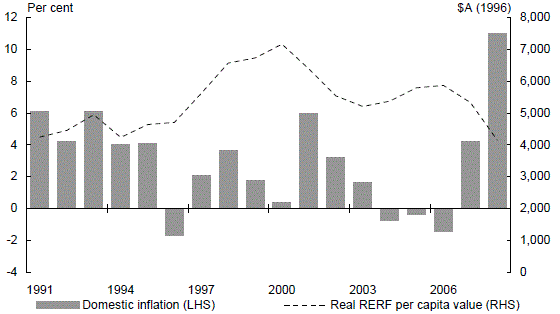
Source: Graham 2005, IMF 2009a, IMF 2009d and Treasury estimates.
The Nauru Phosphate Royalties Trust
Nauru, a 21 square kilometres nation in the Pacific Ocean, is the world’s smallest independent republic. The 10,000–strong population resides on the green rim of the island which circles a large, heavily–mined phosphate deposit. The economy is dominated by government activity, including a large state–owned enterprise sector. As in Kiribati, the Australian dollar is the local currency.
At the time of independence in 1968, the Nauru Phosphate Royalties Trust (NPRT) was established to hold revenue from phosphate mining. The NRPT was composed of four funds, established for separate reasons: the Long–Term Investment Fund, the Land Owners’ Royalty Trust Fund, the Housing Fund, and the Rehabilitation Fund. While formally the NRPT and the state’s budget were separate, in practice there was little distinction.
The first twenty years of nationhood saw phosphate production average around 1.6 million tonnes annually. Production fell from the late 1980s and the mine closed in 2003 (Chart 3). The mining of secondary deposits began in late 2005 but significant additional costs mean production is highly dependent on prices (Cox 2009).
Chart 3: Nauru phosphate expor
ts and the world phosphate price
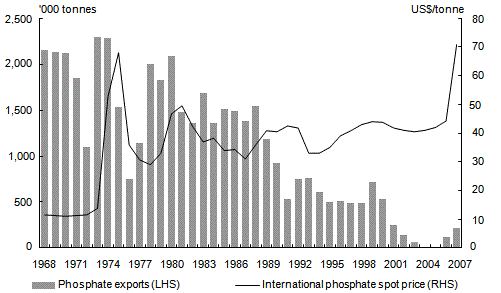
Source: Hughes 2004 and IMF.
The fall in phosphate exports in the 1990s brought with it fiscal deficits, as government revenue fell and expenditure continued to increase (Hughes 2004). While data on the NPRT are difficult to obtain, its value is estimated to have declined from A$1.3 billion in 1990 to A$300 million in 2004 (Toatu 2004). The Nauruan government also borrowed, at high interest rates, against the NPRT to finance public expenditure. The NPRT is currently being wound–up; the few remaining assets will be transferred to landowners. Nauru’s public debt now sits at A$869 million, around 30 times GDP (Government of Nauru 2009).
The exhaustion of proceeds from phosphate mining was achieved through many channels. Governance of the NPRT was particularly poor and many private fortunes were made from the mismanagement of the fund (Hitt 2000 and Hughes 2004). The investment strategy of the NPRT saw most phosphate revenue invested in international property, rather than fixed–income assets or equities. These investments saw significant losses in the 1990s and Nauru’s property portfolio was seized by receivers in 2006 as the country’s debts rose. In addition to investment losses, much phosphate revenue was lost to low quality expenditure rather than investments in productivity–increasing physical or human capital.
Timor–Leste
Timor–Leste, located 600 kilometres northwest of Darwin, is one of the world’s youngest nations, achieving full independence in 2002. The economy is dominated by an offshore oil and gas sector eight times bigger than all other sectors combined. The non–oil economy is concentrated on subsistence agriculture and government consumption and investment. The US dollar is used as the local currency. On many measures, Timor–Leste is the one of the poorest countries in the Asia Pacific region.6
The introduction of large–scale oil production in 2004 resulted in significant revenue increases for the Timor–Leste government — over 2006–2008 average annual revenue from oil and gas was equivalent to 320 per cent of non–oil GDP.
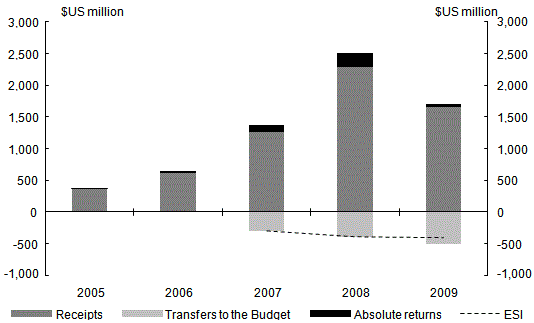
The Petroleum Fund was established in August 2005 to manage oil and gas revenue and is administered by the Timor–Leste Banking and Payments Authority (BPA) (effectively the central bank). Royalties and tax revenue from the oil and gas sector are automatically deposited in the Fund. At the end of 2009 the Fund was worth US$5.4 billion or more than 8 times non–oil GDP (Chart 4).
Chart 4: Petroleum Fund receipts and value
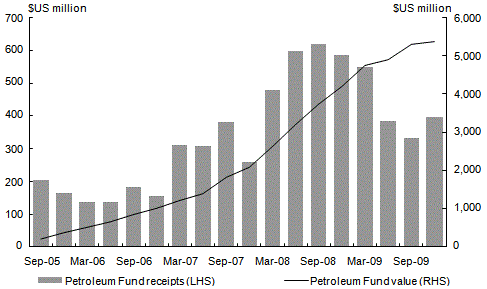
Source: Timor–Leste BPA.
All investments are currently made in developed country government bonds, although legally 10 per cent of the fund may be invested in equities.7 The average annual rate of return on funds invested has not been enough to maintain the domestic purchasing power of the Fund (IMF 2009c). This has caused some to call for investment diversification but to date there have been no moves in this direction.
The Petroleum Fund has numerous processes in place to foster transparency. The BPA and the Government publish quarterly and annual reports respectively on the Fund’s revenue, investment strategy and performance, and transfers to the national budget. Recently, the BPA has introduced monthly reporting and the minutes of meetings of the Investment Advisory Board are made public. Timor–Leste has also committed to the Extractive Industries Transparency Initiative (EITI)8 and in late 2009 published its first EITI report detailing oil and gas revenue received in 2008.9 Timor–Leste is a member of the International Forum of Sovereign Wealth Funds and has indicated its intention to implement the Santiago Principles (IAB 2008).10
In the absence of extenuating circumstances, the Government is unable to withdraw more than the Estimated Sustainable Income (ESI) annually from the Fund. The ESI is designed to ensure a constant steam of revenue from the Fund in perpetuity and is set at 3 per cent of petroleum wealth (calculated as the balance of the Fund plus the net present value of future petroleum revenue). If the government wishes to withdraw more than the ESI it must provide a ‘detailed explanation to parliament of why it is in the long–term interests of Timor–Leste’.11
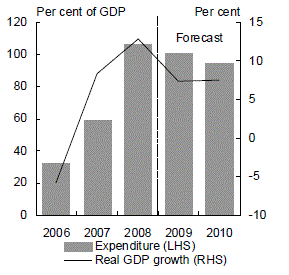
Transfers from the Petroleum Fund finance around 90 per cent of the national Government’s budget and have allowed expenditure to rise to 100 per cent of non-oil GDP. Strong growth in government expenditure has helped increase annual economic growth to an average 9 per cent over 2007–2009 (Chart 5).
Chart 5: Expenditure, financing and economic growth
Financing of expenditure
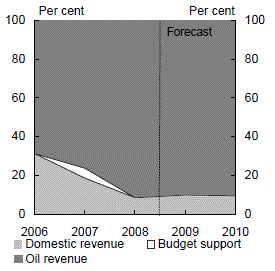
Expenditure and economic growth
Source: IMF 2009c.
Over the last three years, the Timor–Leste Government budgeted to withdraw more than the ESI from the Petroleum Fund, but difficulties with budget execution in 2007 and 2008 kept drawdowns at the sustainable level. In 2009, the Government withdrew US$512 million from the Petroleum Fund, US$77 million less than approved by Parliament, but above the ESI of US$408 million (Chart 6). The 2010 Budget aims to return withdrawals to a sustainable level.
Chart 6: Petroleum Fund receipts and withdrawals
Source: Timor–Leste BPA.
The significant value of the Petroleum Fund, juxtaposed with Timor–Leste’s pressing development needs, has increased pressure on the Government to draw down more than the ESI from the Fund. Theoretically, there may be strong case for investing more oil and gas revenue in Timor–Leste’s physical and human capital; with such a low capital base, the social returns from such expenditure could be higher than the financial returns the Petroleum Fund can achieve (Collier et al. 2009).12
At this time, however, public service capacity is uneven, constraining the state’s ability to deliver productivity–increasing capital works. Inefficient government expenditure could also slow the rise of Timor–Leste’s nascent private sector by inflating wages and pushing up construction costs.13
Papua New Guinea
Papua New Guinea (PNG), located to the north of Australia, gained independence in 1975. GDP per capita is low relative to other Pacific island nations and the majority of country’s 6.8 million people rely on subsistence agriculture. The formal sector is dominated by resource extraction, primarily gold, oil and copper. PNG’s mineral wealth has seen it use two different methods of revenue management.
Mineral Resources Stabilisation Fund
The PNG Mineral Resources Sta
bilisation Fund (MRSF) was established in 1974 following commencement of production at the Panguna copper mine on Bougainville. The aim of the Fund was to reduce the impact of mining revenue volatility on the budget (Parsons and Vincent 1991).
Tax, royalty and dividend payments from all mining and oil enterprises were placed in the MRSF rather than in consolidated revenue. The Fund’s capital was then used to finance the budget. The MRSF was held in the Bank of PNG (the central bank), not invested, and was managed by selected departmental secretaries (Duncan et al. 1995).
The 1974 Act establishing the Fund specified a complex formula to decide the maximum rate of yearly withdrawal. Relying on price and production forecasts, the likely financial flows into the MRSF over five years were projected. The maximum withdrawal for the current year was the maximum amount that could be sustained, in terms of real purchasing power, over the following five years, based on the forecast MRSF income.
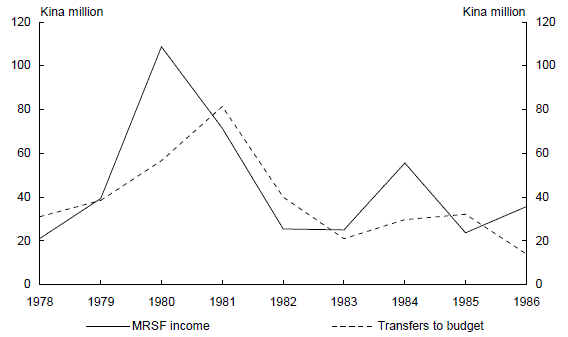
As anticipated, revenue into the Fund was highly volatile. Contrary to the Fund’s purpose however, so were transfers from the MRSF to the Budget (PEB 1987). Most importantly, forecasting sustainable withdrawals proved difficult — the estimated sustainable drawdown rose from K31 million in 1978 to more than K80 million in 1981 before dropping to around K20 million in 1983 (Chart 7) (Duncan et al. 1995).
Chart 7: MRSF income and transfers under original withdrawal rules
Source: Parsons and Vincent 1991 and AusAID 1995.
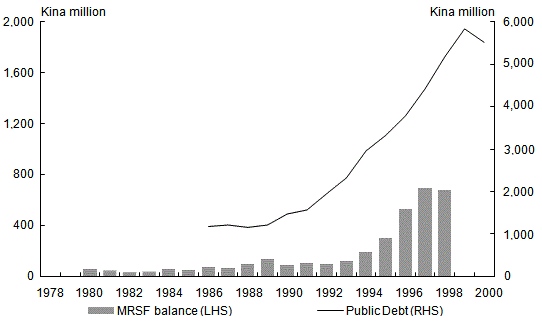
Amendments to the MRSF Act in 1986 further reduced the utility of the Fund by allowing the government to drawdown as much of the MRSF as it wished. Even when the Fund was growing in value, the PNG government borrowed heavily, reducing its net asset position severely (Sugden 2005) (Chart 8).14
The Fund was effectively closed in 1999, with the final balance used to reduce the country’s ballooning debt. Thereafter, inflows matched outflows keeping the balance at zero and the MRSF remained in nothing but name.
Chart 8: MRSF balance and public debt (1978–2000)
Source: Parsons and Vincent 1991, AusAID 1995 and Bank of PNG.
The public trust funds
Due to the mid–2000s commodity price boom, PNG Government revenue more than doubled from 2003 to 2007 on the back of a near fivefold increase in mineral revenue. In response, the PNG Government ran budget surpluses for five consecutive years, peaking at around 9 per cent of GDP in 2007 (Chart 9). While a portion of the surpluses were dedicated to paying down unfunded superannuation liabilities and public debt,15 the majority was saved in trust funds. This approach was codified in 2008 in the Government’s Medium Term Fiscal Strategy (MTFS).
Chart 9: PNG Government revenue and fiscal balance(a)
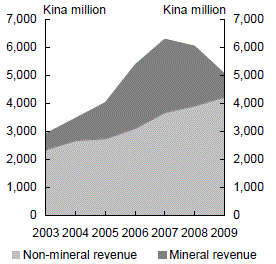
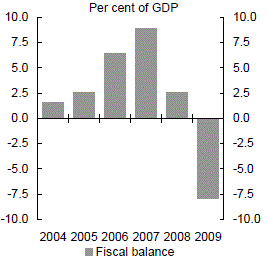
(a) Fiscal balance on the IMF Government Finance Statistics basis. 2009 data are based on annualised forecasts from the 2010 PNG Budget except trust fund expenditure which is actual January to September data.
Source: Government of PNG 2009, Treasury estimates.
Rather than using one fund, PNG saved fiscal surpluses in multiple trust funds. When placed in trust, revenue was assigned to an expenditure project or sector and, as a result, did not receive further allocative scrutiny when spent. While the trust funds had a short–term saving objective, their main goal was to smooth expenditure and therefore improve spending quality and aid macroeconomic stability. PNG fiscal policy worked countercyclically over 2005 to 2008 as the economy expanded strongly, with trust fund savings peaking at around K3 billion (15 per cent of GDP) in mid–2008.
Due to lower commodity prices, PNG mineral revenue fell 60 per cent in 2009, pushing total revenue down 17 per cent. Government expenditure increased, however, as around half of trust fund balances were drawn down.16 While fiscal policy appeared to overshoot in 2009, trust fund savings ensured government expenditure did not fall as the global recession spread and economic growth slowed.
PNG’s trust fund management provides an insight into the issues that can be faced when managing the impact of natural resource extraction. Faced with limited domestic options, a significant number of the Government’s trust funds were (and continue to be) held at local commercial banks earning less than 1 per cent interest. Concurrently, the central bank issued bonds at much higher interest rates to absorb excess liquidity, in part to sterilise its intervention against significant exchange rate appreciation.17 As a result, the commercial banks were able to use the trust funds to purchase central bank bonds, achieving significant low risk returns. Moreover, the central bank’s bond issuance did not fully sterilise its increased foreign reserves, boosting credit growth at a time when the economy was expanding strongly (IMF 2009b).
Chart 10: PNG trust funds(a)
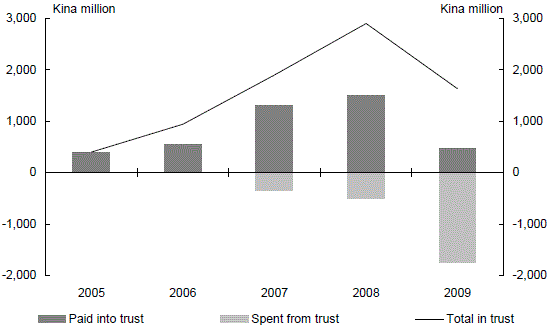
(a) All figures are annual except 2009 are which year to September. Source: Government of PNG 2009, Treasury estimates.
PNG’s experience with trust funds is also a reminder that revenue management must be coupled with efforts to strengthen public financial management more broadly to ensure resource revenue translates into improved development outcomes. Trust fund expenditure is increasingly taking place at the district level where limited implementation capacity has meant resources are not being devoted to much needed capital works (IMF 2009b, Pendene 2010). In addition, the 2010 PNG Budget notes that no financial or project reporting has been provided for over half of the expenditure from trust accounts over January to September 2009.18
Lessons and principles
The mixed record of countries in the Pacific using SWFs to manage natural resource revenue is illustrative. Utilising resource revenue to improve development outcomes is difficult, and what works in one country will not necessary work in another. Despite this, lessons from past experience, and the work of the International Forum of Sovereign Wealth Funds, can inform a set of general principles that should increase the chance of success with SWFs in the Pacific.19
First, it is important that any SWF be considered in the context of a wider macroeconomic and fiscal framework — the opportunity costs of establishing a SWF can be significant. The higher a county’s public debt burden, for example, the greater the case for devoting resource revenue to debt retirement.20 For Pacific island countries, which often face high borrowing costs, the savings made on debt retirement will regularly exceed the returns on revenue saved in a SWF. Alternatively, in Pacific island countries with managed exchange rates, windfall revenue c
ould be added to the central bank’s foreign reserves to assist in currency interventions, and possibly prevent a balance of payment crisis. Finally, the state may have the capacity, at least if resource revenue is forecast to rise slowly, to spend the revenue effectively as it is accrued and achieve a higher social rate of return than the financial rate of return available to a SWF.21
Second, if a SWF is to be established, it should have a clear, widely agreed upon purpose. As experience in the Pacific shows, SWFs can serve different goals, from reducing revenue volatility to increasing intergenerational equity. Regardless of the particular aim, popular understanding and support of the SWF’s purpose can increase the degree of public oversight and improve accountability. It can also limit ad-hoc changes to the fund’s objectives.
Third, withdrawal guidelines should be adopted. The manner in which funds are withdrawn from the SWF will depend on its purpose. For example, Kiribati, which is unlikely to benefit from significant natural resource revenue again, has aimed to maintain the real per capita value of the RERF so that it can contribute to the budget in perpetuity. Although unsuccessful, the PNG MSRF was established to reduce revenue volatility and a drawdown formula that reflected this was established.
Regardless of the purpose of the SWF, in most cases, withdrawal rules that encourage saving during periods of strong revenue growth and help smooth revenue fluctuations during downturns are preferable (Perry 2003). Both the MSRF and the Petroleum Fund were/are procyclical, transferring more revenue to the budget when commodity prices are high and less when they are low. The PNG trust funds, on the other hand, were used relatively countercyclically.
Fourth, in addition to guidelines governing the amount that can be withdrawn annually to finance the budget, other fiscal rules, such as limiting borrowing against the SWF or building up substantial public debt could help to preserve the net value of the state’s resources (Davis et al. 2001).
Fifth, the SWF should be integrated with the national budget. While it may be tempting to establish alternative expenditure institutions to bypass the low public service capacity in some Pacific island countries, duplicating public financial management processes is unlikely to address the reasons for poor government effectiveness. All withdrawals from the SWF should go through the normal budget process, allowing policymakers to consider the state’s resources in their entirety. Such an approach needs to be accompanied by broader efforts in budgetary oversight. In the Pacific, the Timor–Leste and Kirbati SWFs provide good examples of budget integration. Strong budget oversight can also mitigate risks of the resource revenue being spent multiple times.
Sixth, the SWF should be held offshore if resource extraction is thought to be temporary or where the revenue could adversely interfere with the conduct of monetary policy. In such instances, holding resource revenue offshore can reduce upward pressure on the exchange rate, mitigating risks of Dutch Disease by ensuring the otherwise large financial inflows into the domestic economy are carefully managed. Holding the SWF offshore can also increase investment options — financial markets in the Pacific generally offer only limited investment opportunities suited to SWFs.22 Both the Timor–Leste and Kiribati SWFs hold their assets offshore, taking full advantage of global financial markets.
Seventh, professional investment management is necessary to ensure the SWF achieves solid returns, diversifies risk and is not open to manipulation. The state should set a clear investment policy that reflects its risk appetite, including a target rate of return. Generally, investments should be in financial instruments rather than local projects to reduce the chance the SWF will act as a second arm of expenditure policy.
Finally, transparency around the operations of the SWF is vital (IWG 2008). Regular reporting of receipts, investment decisions and returns, and transfers to the budget support public oversight and help to prevent revenue misuse. Additional auditing of revenue as it flows into the SWF under the EITI guidelines provides further oversight and gives positive signals to international investors about anti–corruption efforts. The Timor–Leste transparency guidelines are a good example of what can be achieved in this area.
Conclusion
This paper has argued that Pacific island countries face challenges converting natural resource wealth into improved social outcomes. SWFs have been utilised to help meet some of these difficulties. The experience in the Pacific allows general principles for improved SWF management to be drawn.
Each country, however, will have different needs and goals, necessitating different institutional systems for managing natural resource revenue. Priority should be given to ensuring SWF transparency and professional investment management if risks centre on reduced government accountability and corruption. Where Dutch Disease effects may be expected, the SWF can be held offshore. Withdrawal rules and other fiscal guidelines can assist in reducing waste and the impact of expenditure on inflation if the main concern is to mitigate weakening of government effectiveness.
Yet despite the utility of SWFs, they are not a panacea. The institutions and rules established to manage resource revenue are only as strong as the political culture supporting them. And even if SWFs are employed effectively, capitalising on natural resource wealth in the Pacific requires improvements in many other areas including physical infrastructure, government service delivery, private sector conditions and human capital formation.
References
Ades, A and Di Tella, R 1999. ‘Rents, Competition, and Corruption’, American Economic Review, vol. 89, no. 4, pp. 982–993, September.
Asian Development Bank (ADB) 2007, Nauru Country Economic Report, Manila. Asian Development Bank (ADB) 2008, Kiribati Social and Economic Report, Manila.
Australian Agency for International Development (AusAID) 1995, ‘Papua New Guinea: Improving the Investment Climate’, International Development Issues, no. 39.
Bank of Papua New Guinea (PNG) [various], Quarterly Economic Bulletin, Port Moresby.
Collier, P 2007, The Bottom Billion: Why the Poorest Countries Are Failing and What Can Be Done About It, Oxford University Press.
Collier, P, van der Ploeg, F and Venables, A 2009, ‘Managing Resource Revenues in Developing Economies’, Oxcarre Paper, Oxford.
Corden, W 1984, ‘Booming Sector and Dutch Disease Economics: Survey and Consolidation’, Oxford Economic Papers, vol. 36, no. 3, November.
Cox, J 2009, ‘The money pit: an analysis of Nauru’s phosphate mining policy’, Pacific Economic Bulletin, vol. 24, no. 1.
Davis, J, Ossowski, R, Daniel, J and Barnett, S 2001 ‘Stabilization and Savings Funds for Nonrenewable Resources: Experience and Fiscal Policy Implications’, IMF Occasional Paper 2001, April.
Devlin, W and Brummitt, B 2007, ‘A few sovereigns more: the rise of sovereign wealth funds’, Economic Roundup, Spring.
Duncan, R, Larmour, P and Hunt, C 1995, ‘“Held in trust”: the role of public funds in economic management’, Pacific Economic Bulletin, vol. 10, no. 2.
Fairbairn, T 1994, ‘Minerals boom in Papua New Guinea: key management issues’, Centre for South Pacific Studies, Sydney, University of NSW.
Government of Nauru 2009, ‘Republic of Nauru 2009–10 Budget’, Nauru.
Government of Papua New Guinea (PNG) 2009 ‘2010
National Budget’, Port Moresby.
Graham, B 2005, ‘Trust Funds in the Pacific: Their Role and Future’, Asian Development Bank Pacific Studies Series, Manila.
Gregory R 1976, ‘Some implications of the growth of the mineral sector’, Australian Journal of Agricultural Economics, vol. 20, no. 2, pp. 71–91.
Grynberg, R and Forsyth, D 1993, ‘Current economic trends in the South Pacific’, Pacific Economic Bulletin, vol. 8, no. 2.
Gylfason, T and Zoega, G 2001, ‘Natural Resources and Economic Growth: The Role of Investment’, EPRU Working Paper Series 01–02, Economic Policy Research Unit, University of Copenhagen.
Hitt, J 2000, ‘The Billion–Dollar Shack’, New York Times, 12 October.
Hodler, R 2006, ‘The Curse of Natural Resources in Fractionalized Countries’, European Economic Review, vol. 50, Issue 6, August 2006, pp. 1367–1386
Hughes, H 2004, ‘From Riches to Rags: What Are Nauru’s Options and How Can Australia Help?’, Issue Analysis, Centre for Independent Studies.
International Financial Services London (IFSL) 2009, Sovereign Wealth Funds 2009, March,
www.ifsl.org.uk/upload/CBS_Sovereign%20Wealth%20Funds%202009.pdf.
International Monetary Fund (IMF) 2006, Papua New Guinea: Staff Report for the 2006 Article IV Consultation, Washington D.C.
International Monetary Fund (IMF) 2009a, Kiribati: Selected Issues and Statistical Appendix, Washington D.C.
International Monetary Fund (IMF) 2009b, Papua New Guinea: Staff Report for the 2008 Article IV Consultation, Washington D.C.
International Monetary Fund (IMF) 2009c, Timor–Leste: Staff Report for the 2009 Article IV Consultation, Washington DC.
International Monetary Fund (IMF) 2009d, World Economic Outlook, Washington D.C. International Monetary Fund (IMF) [various], International Financial Statistics, Washington D.C.
The International Working Group of Sovereign Wealth Funds (IWG) 2008, ‘Generally Accepted Principles and Practices — “Santiago Principles”‘, October.
Isham, J, Pritchett, L, Woolcock, M and Busby, G 2003, ‘The varieties of the resource experience: How natural resource export structures affect the political economy of economic growth’, World Bank, Washington D.C.
Kolo, P 2009, ‘Millions gone: K2.2m disappears from the Tewai Siassi account’, Post Courier, 12 November.
Le Borgne, E and Medas, P 2007, ‘Sovereign Wealth Funds in the Pacific Island Countries: Macro–Fiscal Linkages’, IMF Working Paper.
Mehlum, H, Moene, K and Torvik, R 2006, ‘Cursed by resources or institutions?’
Economic Journal, vol. 116, no. 508, pp. 1–20.
Moss, T and Young, L 2009, ‘Saving Ghana from Its Oil: The Case for Direct Cash Distribution’, Center for Global Development Working Paper 186, Washington D.C.
OECD 2008, ‘Economic Geography and GDP Per Capita’, in Economic Policy Reforms: Going for Growth, OECD, Paris.
OECD 2008, ‘Governance, Taxation and Accountability: Issues and Practices’, DAC Guidelines and Reference Series, Paris.
Pacific Economic Bulletin (PEB) 1987, ‘The Papua New Guinea Mineral Resources Stabilization Fund’, Pacific Economic Bulletin, vol. 2, no. 2.
Papua New Guinea (PNG) Treasury 2005, ‘Medium Term Fiscal Strategy 2002-2007’, Port Moresby, July.
Papua New Guinea (PNG) Treasury 2008, ‘Medium Term Fiscal Strategy 2008-2012’, Port Moresby, July.
Parsons, D and Vincent, D 1991, ‘High Stakes: Mineral and Petroleum Development in Papua New Guinea’, Institute of National Affairs Discussion Paper No. 49. Port Moresby.
Pendene, J 2010, ‘Fixing airstrips to help people’, Post Courier, 18 January.
Perry, G 2003, ‘Can Fiscal Rules Help Reduce Macroeconomic Volatility in the Latin America and the Caribbean Region?’, World Bank Policy Research Working Paper 3080, June.
Petroleum Fund of Timor–Leste Investment Advisory Board (IAB) 2008, ‘Minutes of Meeting’, Dili, 28 August.
Price, R, Joumard, I, André, C and Minegishi, M 2008, ‘Strategies for Countries with Favourable Fiscal Positions’, OECD Economics Department Working Papers No. 655, Paris.
Purfield, C 2005, ‘Managing Revenue Volatility in a Small Island Economy: The Case of Kiribati’, IMF Working Paper.
Sachs, J and Warner, A 1995, ‘Natural Resource Abundance and Economic Growth’, NBER Working Paper 5398.
Sugden, C 2005, ‘Making better use of trust funds in the Pacific’, Pacific Economic Bulletin, vol. 20, no. 2.
The Economist 1977, ‘The Dutch Disease’, The Economist, 26 November, p. 82–83. Timor–Leste Banking and Payments Authority (BPA) [various], Petroleum Fund Quarterly Report, Dili.
Toatu, T 2004, ‘Keeping the Nauru economy afloat’, Pacific Economic Bulletin, vol. 19, no. 2.
Truman, E 2008, ‘A Blueprint for Sovereign Wealth Fund Best Practices’, Policy Brief 08–3 Peterson Institute for International Economics, April. UNDP 2009, Human Development Report, New York.
van der Ploeg, F 2007, ‘Challenges and Opportunities for Resource Rich Economies’, OxCarre Research Paper No. 2008–05.
World Bank 2009, World Development Indicators, Washington D.C.
1 The author is from International Finance and Development Division, the Australian Treasury. This article has benefited from comments and suggestions provided by Dan Devlin, Kate Glazebrook, Jason Harris, Christopher Johns, Simon Kerr, David Martine, Tony McDonald, Neil Motteram, Ian Nicholas, Penny Philbrick and Brett Winton. The views in this article are those of the author and not necessarily those of the Australian Treasury.
2 For ease of reference, this paper will include Timor–Leste in the term ‘Pacific’.
3 This is in contrast to OECD countries where ‘endowments in natural resources … have a significant positive effect on GDP per capita’ (OECD 2008).
4 This term was coined by The Economist (1977) in response to the macroeconomic problems experienced by the Netherlands following the commercialisation of the country’s gas reserves. This phenomenon is also known as the ‘Gregory effect’ due to the work of Australian economist Robert Gregory (1976).
5 The International Forum of Sovereign Wealth Funds notes that SWFs exclude ‘foreign currency reserve assets held by monetary authorities for traditional balance of payments or monetary policy purposes, state–owned enterprises in the traditional sense, government– employee pension funds, or assets managed for the benefit of individuals’ (IWG 2008).
6 While GDP per capita is relatively high due to oil production, non–oil GDP per capita on a purchasing power parity basis is $800, well below Kiribati ($2,484), Solomon Islands ($2,610) and the Pacific island average ($3,070) (World Bank 2009). Tim
or–Leste is ranked 158 out of 179 countries on the Human Development Index (UNDP 2009).
7 Most holdings are in US Government fixed interest instruments although recently the Fund has branched out into government bonds from Australia, the Euro zone, Japan and the United Kingdom.
8 The EITI is a coalition of governments, companies and civil society groups which aims to improve governance in resource–rich countries through the verification and full publication of company payments and government revenue from oil, gas and mining.
9 Timor–Leste currently has Candidate Country status under EITI. The next step is to have thecountry’s EITI reporting ‘validated’ by an independent assessor, at which time the country becomes EITI ‘compliant’. The Government has indicated it expects to begin the compliance process shortly. Currently only two countries are recognised as EITI compliant.
10 The Generally Accepted Principles and Practices for SWFs, the Santiago Principles, were published by the International Working Group of Sovereign Wealth Funds in 2008. The 24 voluntary principles reflect appropriate governance and investment practices for SWFs (IWG 2008).
11 East Timor Petroleum Fund Law No. 9 /2005.
12 The geology of Timor–Leste means the country is also likely to benefit from other oil and gas projects in the future (IMF 2009c).
13 Dutch disease effects are less of a concern in Timor–Leste as the country’s currency is the US dollar and a significant portion of government expenditure is dedicated to imports.
14 From 1990 to 1998 the MRSF balance grew K587 million while the government borrowed K1,099 million from the central bank and K704 million from commercial banks. The net asset position of the PNG Government as of 1998 was a domestic debt of K1,795 million and not the saving of K677.3 million recorded in the MRSF.
15 Public debt, much of it external, fell 13 per cent. This, in concert with a strongly growing economy, lowered the debt to GDP ratio from 60 per cent in 2004 to 32 per cent at the end of 2008.
16 Expenditure from trust funds in 2009 appears to be inconsistent with the Government’s MTFS. In the year to September, a net 5.8 per cent of GDP was spent from trust funds. The MTFS limits expenditure from trust to 4 per cent of GDP per year.
17 The central bank allowed the exchange rate to appreciate from mid–2008.
18 See Volume 1, Chapter 3 of the 2010 Budget (Government of PNG 2009).
19 The Santiago Principles, as promoted by the International Forum of Sovereign Wealth Funds, place particular emphasis on SWF governance and sound investment practices (IWG 2008).
20 Repaying domestic debt and external debt can have different macroeconomic effects. In particular, retiring domestic debt can add to liquidity if financial institutions use those funds to lend to private customers.
21 There are two other options for spending resource revenue, although both are less likely to be suitable in the Pacific islands. Firstly, Price et al. (2008) note that at times of surplus in OECD countries, ‘cutting taxes, especially those that are most distortive and detrimental to growth, [can] improve the growth potential of the economy.’ In the Pacific, pressing expenditure needs and concerns around already narrow tax bases count against such a policy response. Secondly, direct disbursement of resource revenue to citizens in developing countries is thought to improve government responsiveness (Moss and Young 2009). In the Pacific, incomplete population records and (in some countries) an uneven acceptance of the state’s right to redistribute wealth would make the implementation of such a policy difficult.
22 Holding the SWF offshore has the added advantage, if a developed jurisdiction is chosen, of increasing the chance of long–term legal predictability.