16 August 2011
Introduction
I'm pleased to have the opportunity this afternoon to talk to you about the GST Distribution Review, which is currently being undertaken by The Honourable Nick Greiner, Bruce Carter, and myself.
Today I want to talk to you about:
- What we're doing in the Review, and what we're not doing;
- Why now is the right time for a review of GST distribution;
- Some factors we've observed in our investigations so far;
- And how all this relates to the subject of today's conference – intergovernmental relations.
The task
On the 30th of March this year, the Commonwealth Government commissioned The Honourable Nick Greiner, Bruce Carter and myself to examine the current form of horizontal fiscal equalisation used to determine the distribution of GST revenues among the States and Territories. The Review is about making sure that Australia is well placed to respond to a number of significant, long term trends, including:
- The rise of China and India, and continuing globalisation;
- The challenge of mitigating and adapting to climate change;
- Population growth and demographic change;
- And the continuing effects of innovation and technological change.
Each of these changes is likely to impact different States in different ways. The challenge is to ensure that each State and Territory is able to continue to provide a broadly equivalent standard of services and infrastructure, and to do this in ways that maximise sustainable growth, and improve quality of life for all Australians.
A major focus of the Review, then, is about maintaining public confidence in the financial relationships within the Australian Federation.
Let me quickly note a few things we are not doing: We are not debating whether horizontal fiscal equalisation should continue. It will continue – and the terms of reference make that clear. We are not reviewing the base or rate of the GST – merely its distribution. And given that I and the other Panel members are still gathering facts and information, and increasing our knowledge about the matters encompassed by the terms of reference, it's too early to provide any specific insights into the content of our interim report due next February, or the final report due in September 2012.
As you know, we've commenced a round of consultations with State Treasurers, Premiers and Chief Ministers – and so far we've consulted with six of the eight states and territories. But we also want to hear a wide range of views. That's why on 1 July we released an issues paper which sets out the scope and task of the review, provides some background material, and raises key questions which may provide a guide for people as they prepare submissions.
And while I can't speculate on the content of our interim report, I can say that the Panel is inclined to examine a range of reform options for discussion in February, rather than being prescriptive at that early stage. That way stakeholders will have a chance to consider our work, and contribute to a second round of consultations based on the interim report. So in a nutshell, that's what we're doing – let me now turn to why we're doing it.
Some basic facts on HFE
First, let's get some basic facts on the table. The total pool of GST revenue for 2011-12 is expected to be around $48 billion. The Commonwealth Grants Commission estimates that about $4 billion of that will be redistributed – that is, not distributed on an equal per capita basis. As you know, GST is distributed according to the principle of Horizontal Fiscal Equalisation, or HFE.
HFE is about providing the States – and when I say 'states' today I include the Territories – with the capacity to provide comparable services to their residents, based on a comparable effort to raise revenue from their tax bases. So if one state has – for reasons beyond its control – a weaker or stronger revenue raising ability per capita than the average of all the states combined – then it gets more or less than equal per capita GST. HFE also adjusts for differences in a state's expenditure drivers; its pattern of Commonwealth payments; and the state's net worth.
So in essence, GST transfers are a balancing item. They recognise inherent fiscal differences that are beyond government control, and allow all states to provide services to their populations of a similar standard.
While the origins of equalisation link back to the period following federation (when WA, SA and Tasmania were compensated for costs associated with federation, such as the impact of federal tariffs and interstate free trade), our current approach to HFE dates back to the 1978 Income Tax Sharing Act.
It's four decades old. It was born in a very different Australia – and a very different world. We've seen successive waves of economic reform in Australia since that time, and new global growth patterns emerging, with differing impacts on the States and Territories. We're also facing important new internal challenges, such as a growing and ageing population.
And so the question for us today is – has the HFE system kept up? Or as our terms of reference put it – will the current form of horizontal fiscal equalisation ensure that Australia is best placed to respond to these challenges and maintain public confidence in the Australian federation?
Today I'd like to highlight one or two factors which have emerged in the Panel's investigations thus far. It's clear that under the current form of HFE, large divergences between a State's revenue or expense situation – compared to the standard – create large GST distribution impacts. Two big areas of divergence today are mining revenue, and expenditure on services for Indigenous Australians.
Mining revenue
I'll address mining first. This is a classic example of how globalisation and the rise of China are impacting – via HFE – on GST payments. Australia is part of a globalised supply chain and in the midst of a commodities boom. Iron ore exports from Western Australia and black coal exports from Queensland have grown dramatically in recent years. And as revenues increase from State royalties, GST to those states has decreased.
In Western Australia's case, its relativity for 2011-12 in the Commonwealth Grants Commission's latest 2011 update report is just 0.72. Compare this to a relativity of greater than 1 – that is, receiving more than an equal per capita share of GST – as recently as 2006-07. If you had suggested back in 2006 that in just a few years WA would have a relativity of only 0.72, you would not have been believed. But that's what has happened – and not only in WA. Somewhat less dramatically, Queensland has also moved from a relativity greater than 1 in 2007-08, to 0.93 for 2011-12.
So we're seeing more rapid change, and greater volatility in the HFE system than we've seen in the past – and it's driven mainly by exogenous forces. The corollary to this is that greater risk of volatility is being brought into the system.
This increased risk not only affects the resource rich states, but also those that are fiscally weaker. Why? Because if royalty revenues were to fall quickly, this would mean that GST revenue to the weaker states would also fall – albeit with a lag.
Now, none of this is to say that the system is broken. But the impacts of external factors on HFE have certainly given rise to an impression in recent times that the resource rich states are bearing an unfair equalisation burden. Balancing this is the fact that, in every year since 1978, NSW and Victoria have been significant donor States – that is, they have always received a less than an equal per capita share of the GST.
Any hint of unfairness can adversely affect public confidence in Australia's federal financial relationships – which is a matter specifically mentioned in our terms of reference.
But not only is our country's mineral wealth concentrated in a few states – creating a big divergence in revenue – when it comes to expenditure, we see a similar divergence among the states.
Indigenous expenditure
Data from both COAG and the Commonwealth Grants Commission indicate that States generally spend more on services for Indigenous Australians than for non-Indigenous Australians, due to their entrenched disadvantage. Accordingly, States with higher proportions of Indigenous Australians get more GST.
Similarly, States spend more on older Australians (for health care), and school-aged children (on education), so States with an above-average number of older Australians or school-aged children also get more GST than those states with below average needs in these sectors. The Northern Territory has a significantly higher proportion of Indigenous Australians than any other state. At 30 per cent, its proportion is twelve times higher than the all state average. So given this huge variation from the average, it's no surprise that the Northern Territory receives such a high per capita share of GST. However, it's interesting to note that the States with the most capacity to influence the Commonwealth Grants Commission's Indigeneity assessment are in fact NSW and Queensland, as they have the highest absolute number of Indigenous people.
Chart 1: All States, proportion of total Indigenous population, 2009
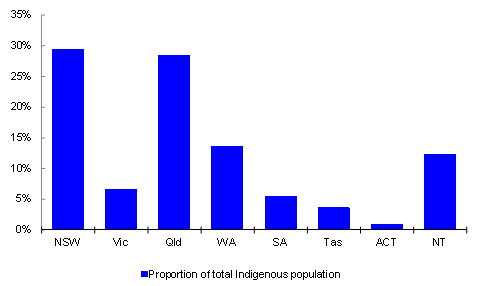
This is because the CGC's assessments are based on a calculation of average spending by States on Indigenous people. States contribute to the average spend in proportion to their share of total Indigenous residents. So the policies applied by the States with the most Indigenous people have the greatest impact on the average.
The claim, therefore, that the Northern Territory can easily influence the amount of GST they receive due to a high proportion of their population being Indigenous, is not correct.
Divergences
As we can see, the divergence between the States in both mining revenue and Indigeneity has grown over the last five years:
Chart 2: All States, funds redistributed from EPC1 due to
mining revenue assessment, $ per capita
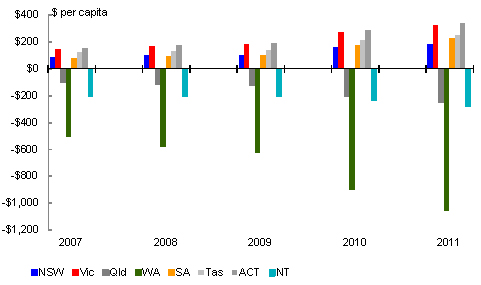
Chart 3: All states except for the NT, funds redistributed from
EPC due to Indigeneity, per capita $
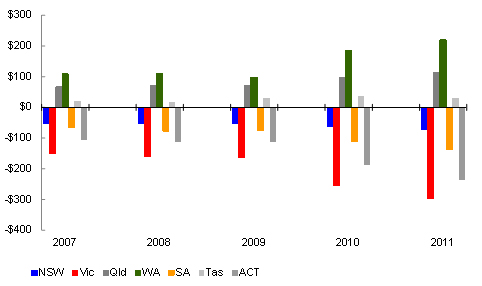
The NT isn't included in this chart (chart 3) as it receives so much for Indigeneity that to include it would dwarf all the other States. In fact, in 2011-12 the NT is expected to receive $6,323 per capita from the Indigeneity assessment, up from $3,710 per capita five years ago. And given that Western Australia has already recorded the lowest ever relativity in the HFE process – and that the current resource boom and indigenous variances are likely to magnify – a review now is timely indeed.
At first glance, you might be tempted to think that the increase in the funds being redistributed means that State needs beyond their control are increasing. This is not necessarily the case, because GST revenue itself is increasing – and as the pool grows, so do transfers to the individual states. Prior to the introduction of the GST, equalisation payments were made through Financial Assistance Grants (or FAGs). FAGs grew at a slower rate than we've seen from the GST. This was in fact one of the reasons for the introduction of the GST – to provide States with a more robust tax base that can be expected to grow over time.
In the years between 2000-01 and 2010-11, the average annual increase in GST payments was 6.5 per cent ... compared with an average annual increase of 3.6 per cent in financial assistance grants in the ten years before that2. And the pool increased significantly at the point that the GST was introduced: The total funds distributed on the basis of equalisation increased from $22.9 billion in 1999‑2000 to $30.2 billion in 2000-01 – a 32 per cent increase.
So at least part of the increase in the amount of funds being moved due to Indigeneity is due to the larger pool size, and the impact this has had on State spending decisions.
HFE in the context of intergovernmental relations
I'd now like to turn to the topic of intergovernmental relations – which is, after all, why we're all here today. Specifically, I want to look at HFE in the context of COAG.
As you know, COAG was born in 1992 – and it was around this time that every jurisdiction in Australia entered the equalisation system. The ACT was the last to join in 1993-94.
So the equalisation system and COAG have been operating in parallel for almost twenty years now. Now, a significant portion of COAG's work over this time has been around economic reform: Reforms in competition policy and regulation. Reforms that have dramatically improved Australia's productivity and efficiency, and been responsible for a sustained period of economic growth and prosperity. And reforms that required close coordination between State and Federal Governments.
More recently, COAG has focused on improving performance reporting and accountability. The 2008 Intergovernmental Agreement on Federal Financial Relations was designed to clearly specify the roles and responsibilities of each level of government, and improve accountability for better outcomes and better service delivery.
The new framework included six national agreements covering critical areas such as health, schools, skills, disability services, indigenous reform and housing. And at the very core of this IGA are the two concepts of efficiency and accountability. The COAG Reform Council will monitor and assess each government's performance against mutually agreed outcomes and performance benchmarks. And they will report publicly on an annual basis.
The upshot of all this is that we now have a National Partnership pool of $17.5 billion in 2011-12, and an SPP pool of $28 billion, which means a total of $45.5 billion3 which is subject to some level of performance reporting or conditionality.
The GST pool, on the other hand – which is expected to be around $48 billion in 2011-12 – is completely untied with no conditionality at all.
As you know, our terms of reference make it clear that all GST revenue will continue to be distributed as untied funding. But it's argued by some that the current GST distribution arrangements provide disincentives to reform. Because revenue gains from reform are redistributed away, incentive is dulled. However, others argue that there is no empirical evidence to support this claim.
So in a COAG environment that is focused on increasing economic incentives for better delivery of government services, this review has been asked to take into account:
- Efficiency considerations;
- Equity considerations;
- Simplicity;
- And predictability and stability.
I'll make just a brief comment about each.
Efficiency
There is some confusion around the extent to which efficiency is already incorporated into existing Commonwealth Grants Commission processes. The answer is that efficiency, as economists conceive it, plays no role in the current process. The CGC aims to provide all States with the capacity to deliver services at the average level of efficiency, if they make the average revenue raising effort. The CGC reference to efficiency simply refers to the variance of a state from the average – which may be regarded as an indication of effectiveness, but it does not relate to economic efficiency.
The question of what role, if any, efficiency should play in the equalisation system is a complex one, and one which the Review will approach with an open mind.
Of course, few would disagree that incentives for strong performance and efficiency are a good thing; but the question is how you bring that about. The influential Dutch economist Jan Tindbergen has argued that the number of policy instruments should be matched to the number of policy targets. So on that basis, if the goal of the HFE system is to equalise state fiscal capacities, then another instrument may be the best way to address an efficiency goal.
And of course there is also the issue of how to reconcile efficiency and performance requirements with the terms of reference requirement that GST payments remain untied.
Equity
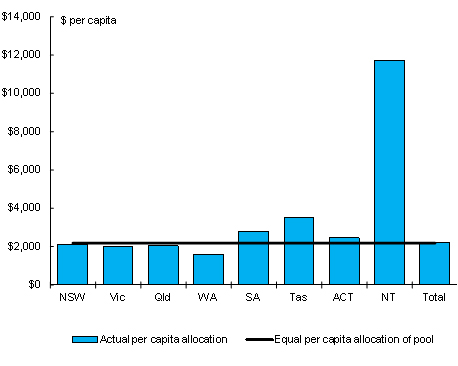
I want to move on now to the question of equity. To recap: The size of equalisation payments to a state is driven by the divergence between its fiscal capacity and the average fiscal capacity. One way of illustrating this is to compare States' actual per capita allocations with the allocations they would receive if the entire pool was distributed on an equal per capita basis, that is the per capita amount of GST each State would receive if all States' had a relativity of one.
Chart 4: Illustrative distribution of 2011-12 GST – actual per capita and
equal per capita allocations
To get a close up of the other States, this is the same chart without the NT...
Chart 5: Illustrative distribution of 2011-12 GST – actual per capita and
equal per capita allocations (without the NT)
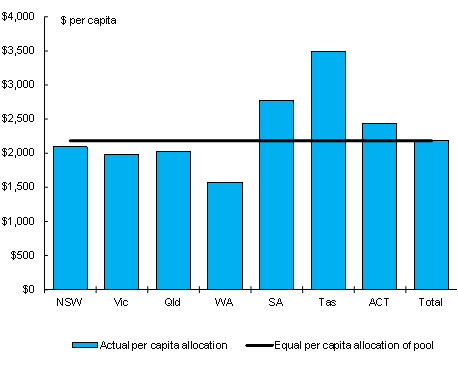
The horizontal line on Chart 4 and 5 demonstrates that, if the total pool was distributed on an equal per capita basis, every State would be expected to receive $2,183.32 GST per person.
The chart also shows that four States currently receive a less than equal per capita allocation — NSW, Victoria, Queensland and WA — and four States currently receive a more than equal per capita allocation — SA, Tasmania, the ACT and the NT.
States which receive a less than equal per capita share have been assessed as having greater than average fiscal capacity to provide a comparable level of services to their residents, as a result of factors beyond their control.
States which receive a more than equal per capita allocation have been assessed as having lower than average fiscal capacity to provide a comparable level of services to their residents – again, as a result of factors beyond their control.
The aim of all this is to ensure that all States have the capacity to provide the same level of services to their residents.
Chart 6: Illustrative redistribution from Equal Per Capita – $ million
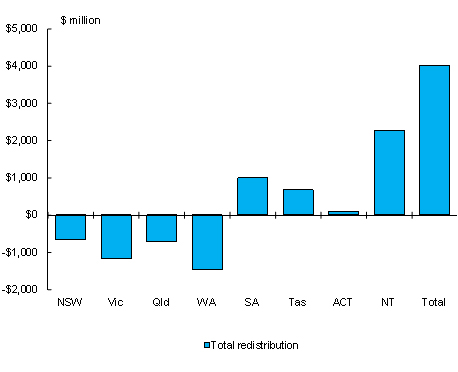
Similarly, Chart 6 shows the redistribution from equal per capita – with NSW, Victoria, Qld and WA receiving less than equal per capita and the remaining States receiving more than equal per capita.
Of course, it's important to remember that only a relatively small proportion of the GST is redistributed between States. In fact, the CGC estimates that for 2011-12 around $4 billion of the total $48 billion of expected GST revenue will be redistributed (that is, money not distributed on an equal per capita basis).
Simplicity
Another key consideration for the review is simplicity. The fiscal equalisation process has long been criticised for being complex. In recognition of this, the CGC's most recent review (the 2010 Review) significantly reduced the number of areas assessed – reducing expense categories from 39 to 14 and revenue categories from 21 to 8 — as well as introducing materiality thresholds.
Nevertheless, given that the states spend around 70 per cent of their budget on health, education, transport, and police and emergency services, strong arguments can be made for even further simplification.
Predictability and stability
Predictability and stability are also strong themes coming through in the Panel's consultations to date. Movements in the distribution of the GST can be driven by a range of factors, including changes in State fiscal circumstances, changes in methodology and changes in data used in the equalisation process.
For example, in the last few years the mineral resources boom has driven significant movement in the GST distribution; however the most recent relativities, those for 2011-12, were also affected by changes in wages data, which indicated that there had been significant increases in wage costs — and hence the cost of providing services — in the resources States.
Previously, significant movements in the GST distribution have also been driven by movements in the circumstances of non-mining States, such as the NSW property boom in the mid-2000s. A key issue that arises in relation to stability is the averaging process – currently, a relativity applying to a particular year is determined by recalculating and averaging the relativities for a number of previous years.
In its 2010 Review, the CGC moved from five to three year averaging. This was done so that the relativities would more closely reflect the States circumstances in the year in which they were applied. However, a longer averaging period does help smooth any adjustments and therefore provides states with improved budget predictability.
Conclusion
So, in concluding, I hope I have given you some indication to the range of matters the review that the review will be considering. These are matters upon which the Panel has sought, and is continuing to seek, views on. The equalisation system plays an important role in the nation's federal relations: Changing global circumstances, and a changing Australia, are having differing impacts on the States and Territories. The challenge for the review is to ensure that Australia has an equalisation system that sees us best placed to respond to these changes.
1. Equal per capita
2. The GST payment figure quoted here does not include health care grants. Over the period when States received health care grants and GST grants (2000-01 and 2008-09), the average annual increase in GST pool (including health grants) was 6.7 per cent.
3. These are estimated 2011-12 figures – taken from the Commonwealth Budget papers for 2011-12 Budget.