Date

Fiscal outlook
Chart 1: Underlying cash balance projected to 2026-27
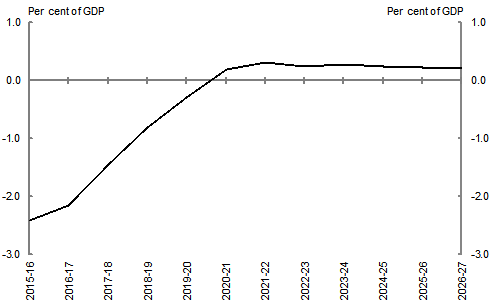
Note: A tax-to-GDP cap of 23.9 per cent is applied to these projections from 2021-22. Net Future Fund earnings are included in projections of the underlying cash balance from 2020-21 when drawdowns from the Future Fund commence.
Source: Treasury projections.
This chart shows the projected underlying cash balance (UCB) from 2015-16 to 2026-27. The underlying cash balance is projected to reach a surplus of around 0.2 per cent of GDP in 2020-21, before peaking at around 0.3 per cent of GDP in 2021-22. By 2026-27, the underlying cash balance is projected to be around 0.2 per cent of GDP.
| Budget | |
|---|---|
| 2014-15 | |
| 2015-16 | -2.4 |
| 2016-17 | -2.2 |
| 2017-18 | -1.4 |
| 2018-19 | -0.8 |
| 2019-20 | -0.3 |
| 2020-21 | 0.2 |
| 2021-22 | 0.3 |
| 2022-23 | 0.2 |
| 2023-24 | 0.3 |
| 2024-25 | 0.2 |
| 2025-26 | 0.2 |
| 2026-27 | 0.2 |