Key points
The Australian economy will continue to prosper as we cut pollution to reduce the risks of dangerous climate change.
Average incomes will continue to rise. In the core policy scenario, gross national income (GNI) per person in today's dollars will be around $9,000 higher in 2020 than it is today and more than $30,000 higher in 2050. From 2010 to 2050, GNI per person grows at an average rate of 1.1 per cent per year in the core carbon pricing policy scenario, compared to 1.2 per cent per year without carbon pricing.
Jobs continue to grow under carbon pricing. In the core policy scenario, around 1.6 million jobs will be created to 2020 and a further 4.4 million to 2050.
Carbon pricing will reduce emissions in Australia and overseas. In the core policy scenario, Australia will meet the emission reduction target of 5 per cent below 2000 levels in 2020 and 80 per cent below 2000 levels in 2050 while the economy continues to grow. Sourcing abatement overseas allows Australia to reduce global emissions at lower cost.
Carbon pricing will drive a structural change towards low emission-intensive products and production processes, and away from more emission-intensive sectors. Most of the economy will be unaffected by these structural changes. Industries employing more than 90 per cent of the workforce account for less than 10 per cent of emissions. While impacts vary widely across industries, the broad sectoral effects are small compared to the normal variation over time driven by productivity, the terms of trade or changing tastes.
Electricity generation will be transformed away from a reliance on coal and towards cleaner technologies, reducing emissions by 60 per cent by 2050 compared to today's levels. The renewable energy sector (excluding hydro) is 18 times as large in 2050 as it is today.
Household consumption continues to grow. The impact on the overall price level is modest at 0.7 per cent in 2012-13 for a $23 carbon price.
All states will continue to prosper while cutting pollution. Effects will differ depending upon their emission intensity and opportunities to diversify to low-emission activities.
The results are broadly similar to the previous modelling exercise in 2008.
Table 5.1: Headline national indicators
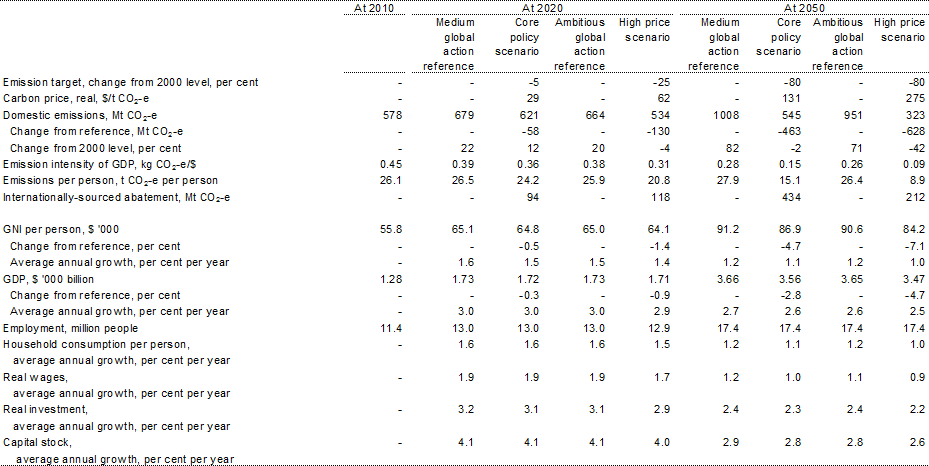
Note: All dollar values are in Australian dollars at 2010 prices. Annual growth rates are from 2010. Initial employment is for 2011.
Source: Treasury estimates from MMRF; and ABS.
5.1 Description of carbon price scenarios
This chapter explores the effects carbon pricing is expected to have on emissions, the Australian economy, the states, the electricity sector, the transport sector and households. The comparison is between medium global action or ambitious global action scenarios, in which Australia does not price carbon, and core policy or high price scenarios, in which Australia prices carbon.
The Australian policy scenarios assume Australia introduces a domestic carbon price into a world where other countries also act to mitigate climate change. They assume a fixed price scheme from 1 July 2012, with the price rising each year, before the Government establishes a flexible price cap-and-trade scheme from 1 July 2015.
The two policy scenarios are:
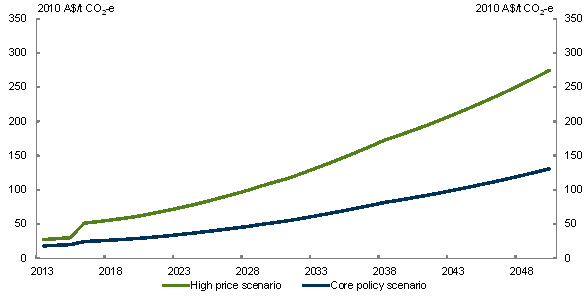
- Core policy scenario — Assumes a world with a 550 ppm stabilisation target and an Australian emission target of a 5 per cent cut on 2000 levels by 2020 and an 80 per cent cut by 2050. Assumes a nominal domestic starting price of A$20/t CO2-e in 2012-13, rising 5 per cent per year, plus inflation, before moving to a flexible world price in 2015-16, projected to be around A$29/t CO2-e.
- High price scenario — Assumes a world with a more ambitious 450 ppm stabilisation target and an Australian emission target of a 25 per cent cut on 2000 levels by 2020 and an 80 per cent cut by 2050. Assumes a nominal domestic starting price of A$30/t CO2-e in 2012-13, rising 5 per cent per year, plus inflation, before moving to a flexible world price in 2015-16, projected to be around A$61/t CO2-e.
The policy scenarios cover emissions from stationary energy, some business transport emissions, industrial processes (other than existing synthetic gases), waste (other than legacy waste) and fugitive emissions (other than from decommissioned coal mines). Overall, this covers around two-thirds of Australia's emissions directly and through other means. Agricultural and land sector emissions are assumed to be excluded from a carbon price, although the Carbon Farming Initiative will reduce emissions in both the global and domestic action scenarios. A carbon price with broad coverage from the start provides more scope for low-cost domestic abatement, maximising domestic emission reductions and reducing the need for Australia to source abatement overseas.
The modelling estimates the economic effects of domestic climate change mitigation policy scenarios to 2050. It does not estimate the benefits of averting dangerous climate change.
The Treasury modelling has been prepared to inform policy design and public discussion about carbon pricing. Treasury has modelled a range of scenarios which explore different environmental targets and design features of a carbon pricing scheme. The modelling provides important insights into the economic impacts of carbon pricing at global, national, sectoral and household levels.
Given the long lead times in commissioning detailed modelling of the electricity generation and other sectors, it was necessary to settle on the broad architecture of the global scenarios in late 2010 and the starting prices for the economy-wide modelling analysis in early 2011. As a consequence, the economy-wide modelling presents scenarios with starting carbon prices in 2012-13 of $20 and $30 /t CO2-e, growing at 5 per cent per year plus inflation before moving to a flexible price. The $20 core policy scenario has a slightly lower carbon price path over the first three years than agreed by the Multi-Party Climate Change Committee (MPCCC), which is for a $23/t CO2-e starting price, growing at 2½ per cent per year plus inflation.
As it is a separate modelling exercise, with shorter lead times, the modelling of household impacts reflect the agreed starting carbon price of A$23/t CO2-e in 2012-13.
The Government's plan has been negotiated with the MPCCC, which has agreed on a comprehensive set of measures to tackle climate change. The Government is separately proposing additional transition and abatement measures, which are separately identified in the policy documentation and fiscal costings. These measures include support for jobs in the coal and steel industries and the inclusion of heavy on-road transport in carbon price coverage from 2014-15.
The economy-wide modelling contained in the modelling report does not include all elements of the final policy package as agreed by the MPCCC. For example, in addition to the slightly lower start price, the core policy scenario assumes unlimited international permits over the entire period, a binding 100 per cent facility allocation cap and that heavy on-road vehicles are subject to an effective carbon price from 2014-15.
Even so, it is expected that the outcome of any updated modelling would closely match the results of the core policy scenarios.
Table 5.2: Policy scenario assumptions
|
Core policy |
High price |
||
|---|---|---|---|
| Carbon price nominal A$/t CO2-e | 2012-13 | $20 $23 for household modelling |
$30 |
| Escalator | 5 per cent per year plus inflation for two years | ||
| Flexible price | Projected to be $29 in 2015-16 | Projected to be $61 in 2015-16 | |
| World stabilisation target | 550 ppm | 450 ppm | |
| Australian emission reduction target | 5 per cent below 2000 levels by 2020; 80 per cent below 2000 levels by 2050 | 25 per cent below 2000 levels by 2020; 80 per cent below 2000 levels by 2050 | |
| Emission-intensive trade-exposed industries (EITE) | Assistance starts at 94.5 per cent or 66 per cent, depending on intensity, and declining at an annual rate of 1.3 per cent per year. | ||
| Fuel | An effective carbon price is applied to: businesses' combustion of liquid fuels from 2012-13 (except light vehicles, agriculture, forestry and fishing) and heavy on-road vehicles from 2014-15, through the fuel tax credit system; and aviation fuel from 2012-13 through the domestic aviation excise system. Private passenger cars are excluded. | Based on the Carbon Pollution Reduction Scheme as at 24 November 2009. | |
| Household assistance | Remaining scheme revenue is allocated to households as lump sum payments. | ||
| International linking | Unrestricted from 2015-16. | ||
| Exclusions | Agriculture, forestry (in terms of mandatory liability for emissions), decommissioned mines, legacy waste and emissions of synthetic gases. | ||
| Allocation | Set as straight line reductions: from the end of the Kyoto commitment period to achieve the 2020 targets; and from 2020 to achieve an 80 per cent reduction on 2000 levels in 2050. | ||
5.1.2 Carbon prices
The modelling assumes domestic carbon prices are fixed initially. After the initial fixed price period, the Australian price follows the international price through linking, either bilaterally or through a multilateral market. Australia's carbon price equals this global price, adjusted for exchange rate changes. From the start of the flexible price period to 2050, Australian carbon prices rise by an average 5 per cent per year plus inflation, reflecting growth in the foreign currency carbon price (based on the Hotelling rule discussed in Appendix B) and gradual depreciation of the Australian dollar.
More ambitious global stabilisation targets require higher carbon prices. The high price scenario assumes the world agrees to a more ambitious stabilisation target and the subsequent global carbon price is more than twice as high (in Australian dollars) as in the core policy scenario.
Chart 5.1: Australian carbon price
Source: Treasury estimates from MMRF.
5.2 Impact on emissions
As part of its plan to secure a clean energy future, the Australian Government has adopted a stronger long-term target. The Government's new target is to reduce greenhouse gas emissions by 80 per cent below 2000 levels by 2050.
Australia's stronger long-term target is consistent with the findings of the Intergovernmental Panel on Climate Change's (IPCC's) Fourth Assessment Report (IPCC, 2007a). It found that, to stabilise carbon pollution concentrations at 450 ppm, developed countries should reduce emissions by between 80 and 95 per cent of 1990 levels by 2050. For Australia, this is equivalent to a reduction of between 80 and 95 per cent below 2000 levels because Australia's emissions grew only slightly between 1990 and 2000. The IPCC judges that stabilisation of carbon pollution concentrations at 450 ppm would provide about a 50 per cent chance of limiting global temperature increases to less than 2 degrees Celsius.
This long-term target of reducing pollution by 80 per cent by 2050 is consistent with targets announced by other developed countries. For example, the United Kingdom has a target of 80 per cent below 1990 levels by 2050, while the European Union has proposed a target of 80 to 95 per cent below 1990 levels by 2050.
The two domestic policy scenarios reflect this stronger long-term target. To meet these targets, Australia can abate domestic emissions or source international abatement by purchasing permits overseas. As climate change is a global problem, a global response that facilitates abatement across borders will deliver environmental outcomes at least economic cost.
5.2.1 Abatement
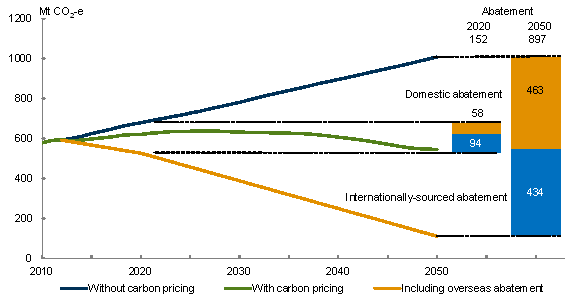
Australia's abatement task is substantial, as outlined in Chapter 4. To meet the unconditional -5 per cent target, Australia's emissions need to fall 152 Mt CO2-e in 2020. To achieve the -80 per cent target by 2050, Australia's emissions need to fall 897 Mt CO2-e. These figures assume that Carbon Farming Initiative credits, worth 7 Mt CO2-e in 2020 and 22 Mt CO2-e in 2050, are sold back into the domestic carbon pricing scheme and help to reduce the abatement task.
Pricing carbon results in deep cuts in domestic greenhouse gas emissions. In the core policy scenario, the carbon price produces: around 58 Mt CO2-e of domestic abatement and 94 Mt CO2-e of international abatement in 2020; and 463 Mt CO2-e of domestic abatement and 434 Mt CO2-e of international abatement in 2050. Despite these cuts, Australia's domestic emission levels continue to rise for some time. In the core policy scenario, Australia's domestic emissions increase around 10 per cent from 2010 to the late 2020s. They then fall significantly as decarbonisation of the electricity sector accelerates.
Chart 5.2: Australian emissions in the core policy scenario
Note: Emissions without carbon pricing include CFI abatement.
Source: Treasury estimates from MMRF.
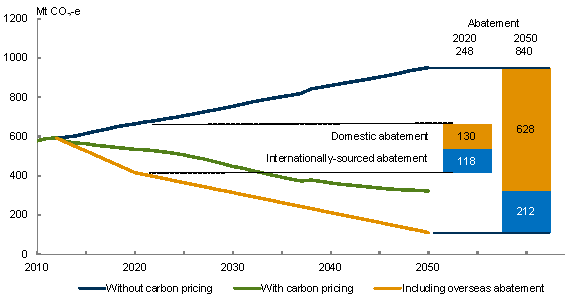
In the high price scenario, carbon pricing produces significantly more domestic abatement in the short term, resulting in emission levels that are lower than today's levels in the first year and that decline thereafter. Around 130 Mt CO2-e of domestic abatement is achieved in 2020 and 628 Mt CO2-e in 2050. Emissions are 8 per cent lower than today's levels in 2020 and 44 per cent below today's level in 2050. In the high price scenario, the abatement task in 2050 is slightly smaller than in the core policy scenario because ambitious global action lowers demand for Australia's energy exports slightly and this reduces Australian emission levels slightly without carbon pricing.
Chart 5.3: Australian emissions in the high price scenario
Note: Emissions without carbon pricing include CFI abatement.
Source: Treasury estimates from MMRF.
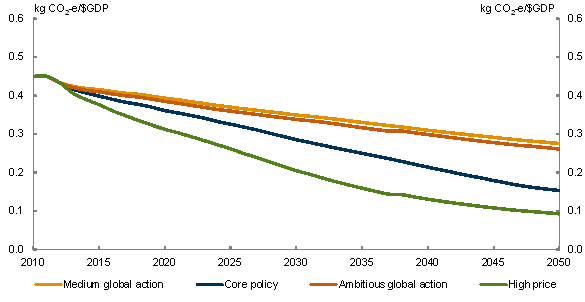
Pricing carbon breaks the link between economic growth and emissions growth, so large cuts in emissions have modest economic costs. The modelling shows growth in the economy as a whole is only marginally slowed, but in both policy scenarios the emission intensity of the economy — measured as the amount of carbon pollution created per dollar of output produced — falls sharply. In the core policy scenario, the emission intensity of the Australian economy falls from around 0.45 kg CO2-e/$GDP in 2010 to around 0.15 kg CO2-e/$GDP in 2050.
Reductions in the emission intensity of the economy occur in two ways: changes in production processes within industries through the adoption of cleaner technology; and the movement of resources towards lower emission-intensive industries, which makes them grow more rapidly, and away from the relatively small proportion of higher emission-intensive industries, which grow slower. In the core policy scenario, reductions in emission intensities within industries account for two-thirds of the reduction in the emission intensity of the whole economy in 2050. The restructuring of the economy to take advantage of new opportunities in a low carbon world accounts for the other one-third of the reduction in the economy's emission intensity.
Chart 5.4: Emission intensity of Australian GDP
Source: Treasury estimates from MMRF.
Box 5.1: A lower starting price means slower transformation of the economy
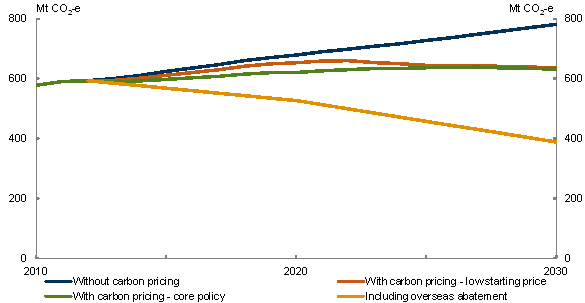
Starting with a lower carbon price and a longer fixed price period would slow the decarbonisation of the economy and result in a larger jump in carbon prices when eventually the economy transitions to a flexible price cap-and-trade scheme.
A sensitivity analysis was run with a nominal domestic starting price of A$10/t CO2-e in 2012-13 rising 5 per cent per year plus inflation over a fixed price period of ten years. The scenario assumes a transition from a fixed price of around A$19/t CO2-e in 2022 to a world price projected to be around A$49/t CO2-e. Like the core policy scenario, it assumes a world with a 550 ppm stabilisation target and an Australian target of a 5 per cent cut in emissions on 2000 levels by 2020 and an 80 per cent cut by 2050.
In this 'low starting price' scenario, much less domestic abatement is achieved in the first decade. The lower carbon price induces only 26 Mt CO2-e of abatement in 2020, less than half of the domestic abatement in the core policy scenario. Since domestic abatement is lower in 2020, the emission target is met with more abatement sourced overseas.
Chart 5.5: Australian emissions to 2030 with a lower starting price
Note: Emissions without carbon pricing include CFI abatement.
Source: Treasury estimates from MMRF.
5.2.1 Emissions by sector
Emission reductions occur at different rates across sectors and over time, reflecting differences in mitigation opportunities. While it is hard to know in advance where the cheapest mitigation opportunities will arise, a carbon price mechanism ensures that abatement occurs at minimum cost to the economy and international linking ensures that domestic abatement does not occur where it would be more expensive than sourcing abatement overseas.
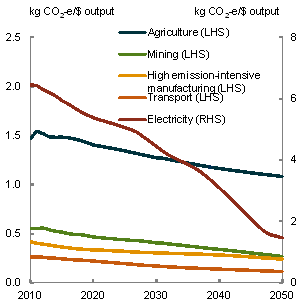
Although all sectors show reductions in emission intensity under carbon pricing, higher mitigation costs slow reductions in emission intensities in some sectors. Over the period to 2050, high emission-intensive manufacturing reduces its emissions intensity by 42 per cent, mining by 52 per cent and the electricity sector by 77 per cent. All economic activities become less emission intensive over time, with larger reductions in combustion emissions than activity emissions.
Chart 5.6: Emission intensity
Core policy scenario
By sector
By emission type
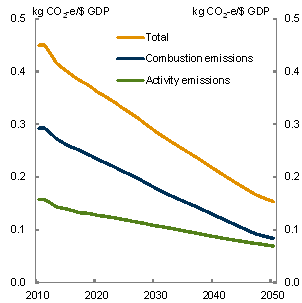
Note: The agriculture sector excludes forestry in these two charts. Levels of emission intensity are not comparable across the two panels; the left panel shows the emission intensity of gross output, the right panel the emission intensity of GDP.
Source: Treasury estimates from MMRF.
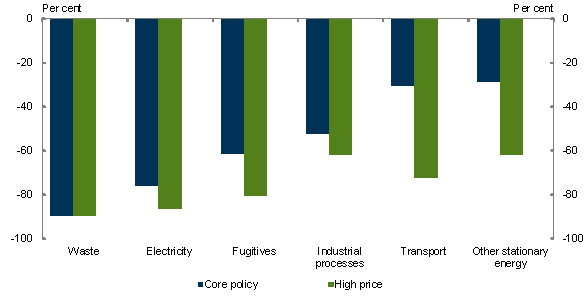
Chart 5.7: Emission reductions by sector
Change from global action scenarios, 2050
Source: Treasury estimates from MMRF.
The reduction in the emissions of each sector compared with the global action scenario reflects both changes in emission intensity of production and changes in the output of each sector. Industrial processes reduce their emissions by around half. The other stationary energy and transport sectors reduce their emissions by a smaller proportion.
One way to assess each sector's contribution to meeting Australia's abatement task is to add up the cumulative emission reductions in the policy scenario compared to the global action scenario over the period to 2050. The shares of emission reductions by sector reflect each sector's overall production of emissions, with sectors with more emissions in the global action scenario more able to contribute to emission reductions, and each sector's potential mitigation costs. By 2050, the electricity generation and fugitives sectors deliver the greatest share of the reduction in domestic emissions.
In the electricity generation sector, emissions decline slowly until the mid 2030s when they start to fall faster as new technology becomes available, such as carbon capture and storage. By 2050, the electricity generation sector provides almost half of total emission reductions. This sector moves towards low-emission technology, such as carbon capture and storage and renewable sources, including wind, solar and geothermal. Reduced electricity sector emissions drive reductions in energy-related emissions in other sectors, as fossil fuel users switch to electricity, particularly in transport where the share of hybrid and full electric plug-in motor vehicles increases over time.
Take up of public transport, fuel switching and purchases of more fuel-efficient vehicles reduce transport sector emissions. Opportunities for water and air transport mitigation cost more, and consumers with higher incomes keep demand strong in these sectors.
Chart 5.8: Share of cumulative emission reductions by sector
Core policy scenario, 2010 to 2050
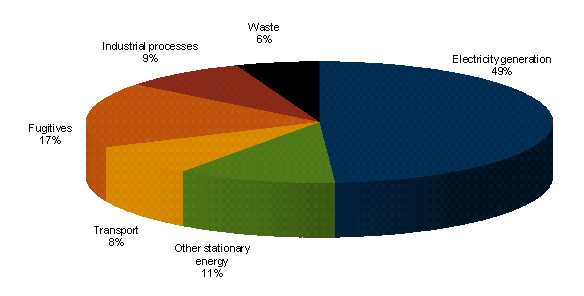
Note: The uncovered sectors of agriculture, forestry and fisheries are excluded from this chart. Abatement due to the CFI is incorporated in the level of Australian emissions in both the medium global action and core policy scenario.
Source: Treasury estimates from MMRF.
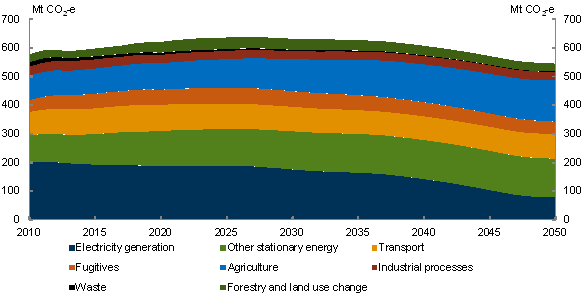
Emissions growth in some sectors continues to reflect output growth with relatively low abatement. For example, agriculture emissions continue to grow, almost doubling to 2050, driven by strong output growth. The Carbon Farming Initiative (CFI) achieves some abatement; however, its voluntary nature and strict additionality requirements means abatement is significantly less than in the previous climate change mitigation modelling (Australian Government 2008).
Chart 5.9: Sector emissions
Core policy scenario
Source: Treasury estimates from MMRF.
5.2.2 Sourcing international abatement
While pricing carbon cuts domestic emissions, it is inefficient to meet the whole abatement task through domestic abatement. Sourcing abatement overseas plays an important role. Purchasing recognised international permits leads to real reductions in global emissions, just like reducing our domestic carbon pollution. Abatement is more expensive in Australia than in most developed economies due to its large share of emission intensive industries. From a global perspective, investment across borders to secure least cost abatement ensures that environmental outcomes are delivered at least cost to the world economy.
Relying entirely upon domestic abatement opportunities, whether through a carbon pricing mechanism or direct government action, would be a much more expensive way to meet Australia's emission targets. In the high price scenario, with a world carbon price of A$62/t CO2-e in 2020 (2010 $), domestic emissions fall by less than 4 per cent by 2020 compared to 2000 levels. Achieving the target of a 5 per cent cut in emissions by 2020 compared to 2000 levels through domestic abatement alone would require a higher domestic carbon price, or more expensive direct action.
Sourcing abatement overseas transfers income from Australia to other countries. The cost depends on the prevailing world carbon price and the exchange rate. In a world where other countries pursue more ambitious abatement targets, the carbon price will be higher and this increases the cost in terms of domestic production and income forgone in achieving a given allocation.
Box 5.2: What would a scenario with less global ambition show?
The scenarios modelled show the implications for Australia of domestic policy action to price carbon in a world that is moving to tackle climate change.
Over 89 countries, including all major emitters, covering 80 per cent of global emissions have pledged action through the Copenhagen Accord and Cancun agreements. Uncertainty remains about the exact pace and extent of international action to tackle climate change, so two plausible global action scenarios are modelled as backdrops for the Australian carbon pricing scenarios: the medium global action scenario is based on the low-end of pledges and a target of stabilising greenhouse gas concentrations at 550 ppm CO2-e by 2100; the ambitious global action scenario is based initially on the high-end of pledges initially and a target of stabilising greenhouse gas concentrations at 450 ppm CO2-e just beyond 2100.
Notwithstanding this progress, some commentators suggest Australia is 'going it alone' and as a result, Australia's mitigation costs will be far greater than reported because impacts on domestic competitiveness will be far greater. This argument is misconceived.
If the extent of global action is less than assumed, then Australian mitigation costs will be lower, not higher, than reported for two main reasons.
First, less stringent world action would strengthen export demand and output for our energy exports.
Second, if global action is less than assumed, world carbon prices will be lower, making it less expensive to source abatement overseas.
Carbon markets already exist through the European Union, the United Nations Framework Convention on Climate Change flexibility mechanisms, the Regional Greenhouse Gas Initiative in the United States, and in Switzerland and New Zealand. Voluntary markets also exist in a range of countries, including Japan. These markets are expected to continue and others to develop. In a linked scheme, Australian firms will be able to meet their obligations by purchasing a domestic permit or by reducing emissions overseas (whether by sponsoring an emissions reduction project or by purchasing a permit from an overseas scheme). As the cost of reducing pollution overseas falls, the economic cost of meeting any emissions reduction target falls.
To be very clear, what this all means is that a hypothetical scenario with less global ambition to tackle climate change would likely result in lower mitigation costs for Australia than reported, not higher as claimed elsewhere.
The modelling only considers the economic costs of climate change mitigation and not the costs of climate change itself. If global action fails, global temperatures will move higher and the impact of climate change will be that much greater.
5.3 The macroeconomy
Real income continues to grow with carbon pricing. This section focuses on the effects of carbon pricing on real gross national income (GNI) per person and how those effects come about. Gross domestic product (GDP) is a measure of the value of production in Australia and is the most common measure of the size of the economy. GNI is a better measure of welfare because it also accounts for that part of domestically generated income that accrues to non-residents, including that part required to pay for abatement sourced overseas. It also accounts for foreign generated income that accrues to domestic residents.
5.3.1 Gross national income
Australia's GNI per person (or real income) in both domestic policy scenarios — core and high price — grows at rates only slightly below those expected without carbon pricing. In the core policy scenario, GNI per person in today's dollars will be $9,000 higher in 2020 than it is today and more than $30,000 higher in 2050 — an increase that is smaller than in the medium global action scenario, in which Australia does not price carbon, by just $320 per person in 2020 and $4,300 in 2050.
Table 5.3: GNI per person
Average annual growth

Note: Average is from 2010 to 2050. Numbers are influenced by rounding.
Source: Treasury estimates from MMRF.
Real income will continue to grow under a carbon price, but at a slightly reduced rate as the domestic economy transforms to be more carbon efficient and as sourcing international abatement causes income outflow. From 2010 to 2050, GNI per person grows at an average rate of 1.1 per cent per year in the core policy scenario compared to 1.2 per cent per year, if carbon levels continue unabated along their upward trajectory. That is, Australia's GNI per person continues to grow at a rate only around 0.1 of a percentage point per year slower than it would without carbon pricing.
Chart 5.10: GNI per person
Level
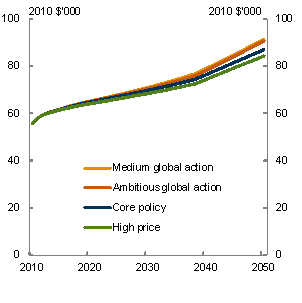
Change from global action scenarios
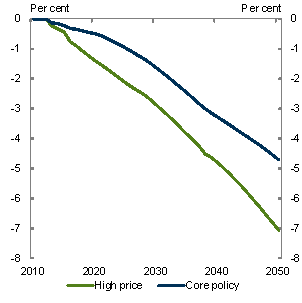
Source: Treasury estimates from MMRF.
Decomposition of the effect on GNI
Carbon pricing affects incomes by affecting a range of links within the economy. Links between firms at successive stages of production, between producers and consumers, and between the domestic economy, import and export markets all play a role. The general equilibrium modelling of the Australian economy incorporates many of these links. Carbon pricing policies can affect economic welfare, measured by GNI, by (Harberger, 1971):
- changing the supply or productivity of factors (technical change and primary factor endowments);
- reallocating existing resources within the economy (allocative efficiency);
- changing foreign income flows through sourcing abatement overseas; and
- changing the terms of trade and exchange rate.
Table 5.4: Decomposition of the effect on the level of GNI

Note: Contributions may not sum to total due to rounding.
Source: Treasury estimates from MMRF.
The largest effect of carbon pricing comes through effects on primary factors of production such as labour, capital and land.
Carbon pricing increases the cost of constructing and running some capital equipment. In aggregate, across the economy, this reduces slightly firms' incentives to invest in capital. It also reduces the rate of growth of emission-intensive sectors, which are typically more capital intensive than the rest of the economy. To 2050, the capital stock grows by 2.8 per cent per year in the core policy scenario, compared with 2.9 per cent per year in the medium global action scenario.
Chart 5.11: Capital stock
Level
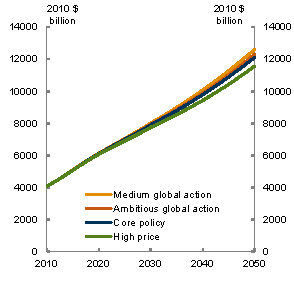
Change from global action scenarios
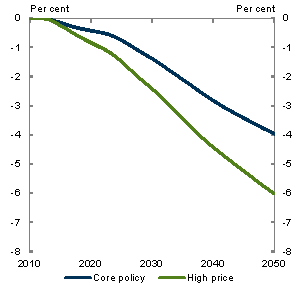
Source: Treasury estimates from MMRF.
Much like other structural adjustments the Australian economy has moved through in the past, carbon pricing also will have an effect on the labour market. Pricing carbon affects the demand for labour, as a result of slower output and capital growth. Real wages grow slightly more slowly than in the global action scenario. The level of employment is largely unaffected. Around 1.6 million jobs are added to 2020 in both the core policy and global action scenario, with a further 4.4 million jobs added by 2050 with or without carbon pricing. Labour moves across industries during the transition to a lower carbon economy, but the rate of movement is low compared with normal rates of job turnover from year to year (Chapman and Lounkaew, 2011).
Chart 5.12: Real wages
Level
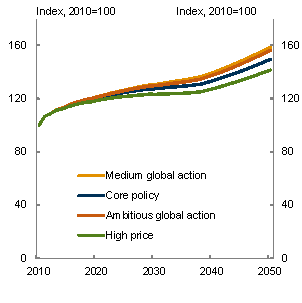
Change from global action scenarios
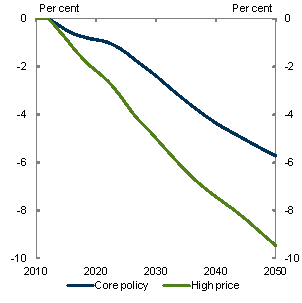
Source: Treasury estimates from MMRF.
Changes in how the economy's resources are allocated between different industries also affects GNI. The current structure of the Australian economy is 'allocatively efficient', in the sense that total output is as large as possible, but this is not socially optimal. Since businesses do not currently pay for the long-term damage done by the carbon pollution they emit, they produce too much pollution.
Carbon pricing will change the mix of activities in the economy. Some goods that would have been produced without a carbon price are forgone, and new goods that would not have been cost effective to produce without a carbon price go ahead. This tends to reduce slightly the rate of output growth within the model because the cost of producing the forgone goods, such as coal-powered electricity, is lower than the cost of producing new goods, such as renewable electricity. This change in the mix of activities results in important reductions in emissions.
Finally, sourcing abatement from overseas involves transferring income from Australia to secure reductions in emissions in other countries.
The other paths by which carbon pricing can affect GNI generally have a smaller effect. Different industries have different rates of technical change and carbon pricing can affect the overall rate of technical change by moving resources into low emission-intensive sectors. Some of these low emission-intensive sectors, such as communications, tend to experience rapid technological change over time, while others, such as public services, tend to change less rapidly. This effect could increase or decrease the rate of growth in GNI from year to year, but in practice, the effect is very small.
Similarly, domestic carbon pricing has little effect on Australia's terms of trade. International action tends to reduce Australia's terms of trade over time by reducing international demand for the fossil fuels, like coal, that we export. This has effects on the level of the terms of trade, but these effects are part of the medium and ambitious global action scenarios. Rather, domestic carbon pricing will tend to lower slightly the Australian exchange rate, by an amount estimated at around 3 per cent by 2050. This will improve the international competitiveness of domestic producers of low emission-intensive goods, but also increase somewhat the cost of other foreign income payments to foreign investors in the Australian economy.
5.3.2 Gross domestic product
GDP continues to grow with carbon pricing, and will be nearly three times as large by 2050 compared to what it was in 2010. GDP grows in the core policy scenario by 2.6 per cent per year to 2050, slightly lower than the rate of 2.7 per cent per year in the medium global action scenario.
Chart 5.13: Gross domestic product
Level
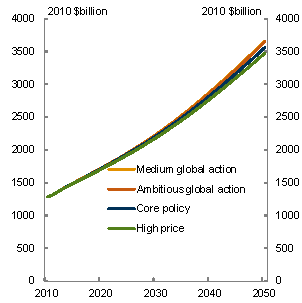
Change from global action scenarios
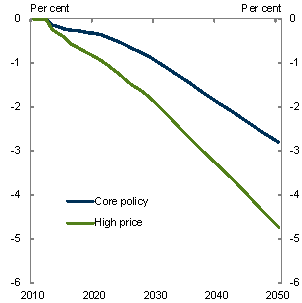
Source: Treasury estimates from MMRF.
The aggregate economic impacts of carbon pricing are similar regardless of whether SKM MMA or ROAM electricity modelling is incorporated. While GDP growth in the global action scenarios is the same, technology costs, wholesale prices and profits differ between the two. A lower emission intensity in ROAM's global action scenario, than in SKM MMA's, means that the abatement task is smaller. With a smaller abatement task, the estimates of the economic impacts of carbon pricing incorporating ROAM's electricity modelling also are slightly smaller. Nevertheless, using either set of electricity sector modelling results in an aggregate impact of carbon pricing on growth in GNI per person of 0.1 of a percentage point per year.
Achieving a target of an 80 per cent reduction will be slightly more challenging than achieving a target of a 60 per cent reduction of 2000 levels by 2050. For a given world carbon price, the most efficient way for Australia to meet the stronger target will be to source additional abatement from overseas. Australia's GNI per person will continue to grow while meeting the stronger target, but somewhat more slowly, to be 0.6 per cent lower in 2050 compared to what it would have been with a 60 per cent target. The size of the economy, measured by GDP, grows at the same rate with an 80 per cent target as with a 60 per cent target.
Box 5.3: Comparison of costs with other studies of mitigation policy
A number of recent studies explore the potential economic impacts of mitigation policy on the Australian economy.
The costs of emission mitigation in this report are within the range of previous estimates. Studies find that even substantial emission reductions can be achieved while maintaining robust economic growth.
The wide range of estimates from published studies reflect the uncertainty about mitigation costs. Studies differ owing to different policy assumptions, model parameters and technology availability and cost assumptions. In addition, cost estimates are strongly affected by emission levels in the global action scenario (which varies across studies) as this determines the scale of economic restructuring required to achieve any given emission reduction goal.
Table 5.5: Mitigation cost estimates: reductions in real GDP and GNI
Change from reference
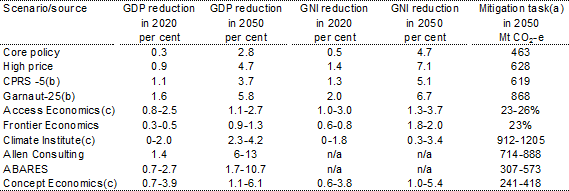
Note: (a) Mitigation task is the difference between emissions in the reference and policy scenarios. (b) CPRS-5 and Garnaut-25 results are from the previous modelling exercise in 2008 (Australian Government 2008) (c) Climate Institute results are for 2030 (not 2020); Concept Economics and Frontier Economics results are for 2030 (not 2050). For Frontier Economics and Access Economics, the reduction of domestic emissions is reported.
Source: Access Economics, 2009; ABARE (Ahamaad et al, 2006); Australian Government, 2008; Climate Institute (Hatfield-Dodds et al, 2007); Allen Consulting Group, 2006; Concept Economics, 2008; and Treasury estimates from MMRF.
5.4 Trends at the sectoral level
Pricing carbon affects the composition of the Australian economy. It drives a structural change to low emission-intensive products and a movement within industries to cleaner technologies and processes. Taking advantage of the economic opportunities in new areas and the cheapest abatement requires a reallocation of resources across the economy.
The impacts of carbon pricing on output and employment growth vary widely across sectors, with some sectors growing faster, and others more slowly. A number of factors influence sectoral impacts: the relative emission intensity of goods and services; the availability of lower emission substitutes; the degree of pricing power domestic firms have, which is influenced by their trade exposure; the degree of pricing power their suppliers have; the relative emission intensity of domestic production compared to international competitors; the cost of potential mitigation options; coverage of the carbon price scheme; and the extent of government assistance.
Industries that provide relatively low emission-intensive substitutes for other goods will grow fastest, as households switch their consumption in response to differences in prices. For example, coal-powered electricity generation becomes relatively more expensive, and gas-powered electricity generation expands rapidly.
This section explores the effects on the economy's overall structure, followed by output profiles and the flow of resources across and within the five major sectors: agriculture, forestry and fisheries; manufacturing; mining; construction; and services. Detailed analysis of the electricity, transport and forestry sectors, using bottom-up modelling, follows. Results are aggregated to an industry level, so impacts on individual firms are not explored.
5.4.1 Structural change and the effects of carbon pricing
The structure of Australia's economy is always evolving. The jobs of the future will be in different industries to those of the past, as discussed in Chapter 4. This will be the case with or without carbon pricing.
The large increase in the relative price of resource commodities in recent years has driven, and will continue to drive, substantial changes. As a result, mining and construction will grow faster. Similarly, as incomes continue to increase and tastes change, the long-term trend towards a service-driven economy continues, as does the relative decline in importance of goods production.
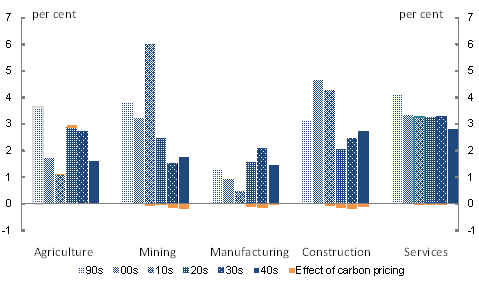
At the broad sectoral level, structural changes due to carbon pricing are much smaller than the effects of ongoing changes in the terms of trade or tastes. Some sectors, such as mining and construction, grow more slowly with carbon pricing, while agriculture grows faster. However, these effects are small compared to the difference in underlying growth trends between sectors, or compared with variation in underlying growth rates within sectors from one decade to the next. Sectors will grow at similar rates with or without carbon pricing.
Chart 5.14: Output growth by broad sector, 1990 to 2050
Annual average growth rates
Medium global action scenario and effect of carbon pricing
Source: Treasury estimates from MMRF.
Much of the effect is due to the transition of resources between different industries within the same sector. Australia continues to have strong manufacturing, mining and construction sectors with carbon pricing. Within manufacturing, some areas are more emission intensive in production and, over time, decline in relative size, while others grow. Slower growth in some areas allows employment and investment to flow into less emission-intensive manufacturing sectors. Within mining, energy extraction industries grow less quickly than they otherwise would, but other parts of the mining industry continue to grow strongly.
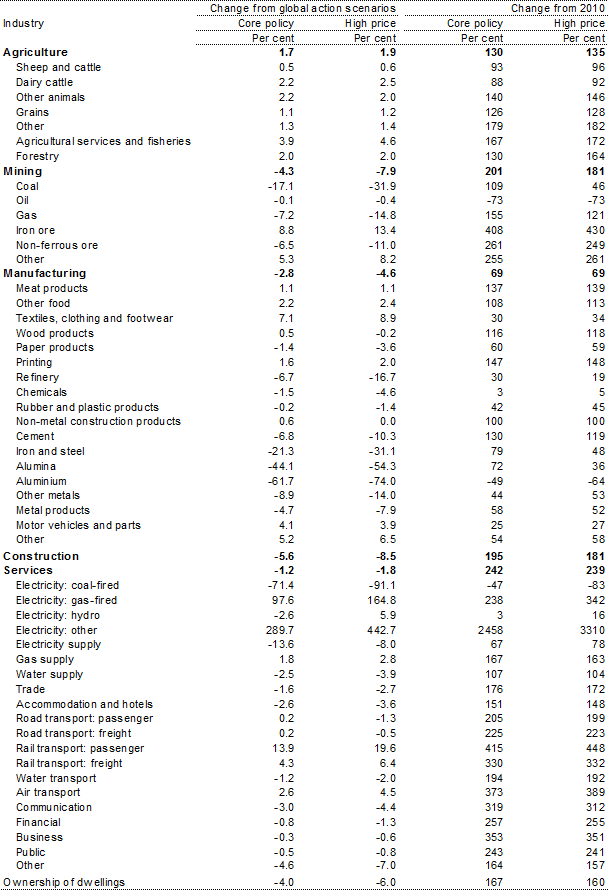
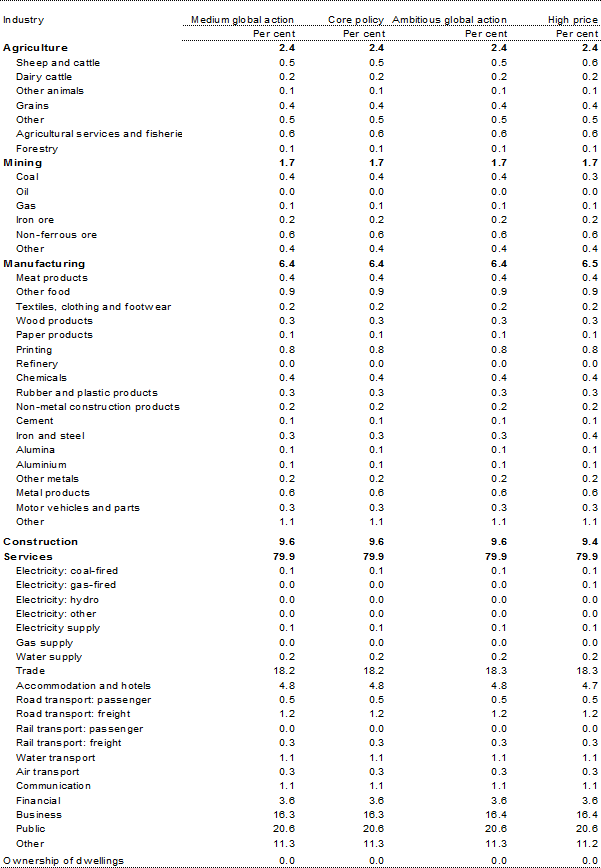
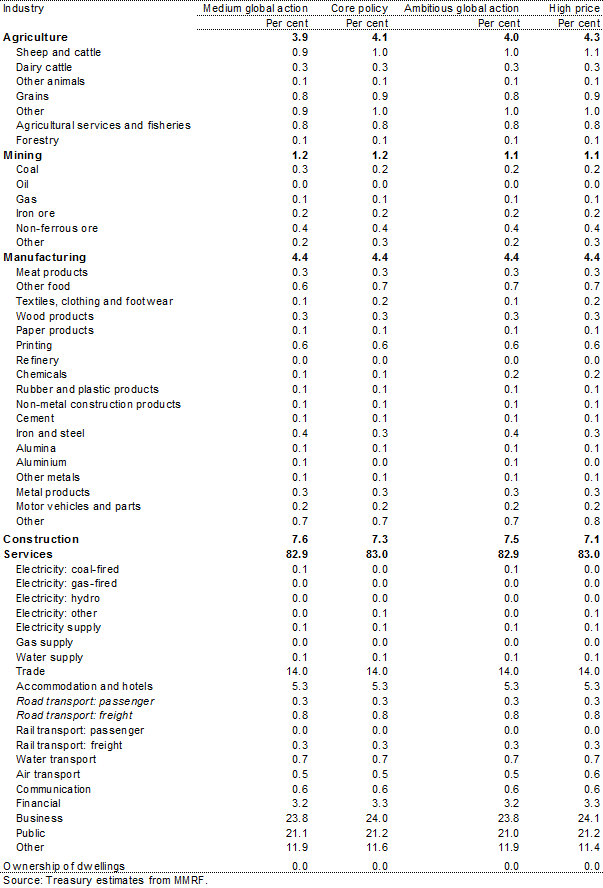
The bulk of the economy is unaffected by these structural changes. More than 95 per cent of industries (by employment share) see their level of employment in 2020 change by less than 1 per cent, up or down, compared to the medium global action scenario. Even industries that experience larger changes in employment, experience small changes as a consequence of carbon pricing compared to the normal flows in and out of employment without carbon pricing (Chapman and Lounkaew, 2011).
Table 5.6: Gross output, by industry, 2020
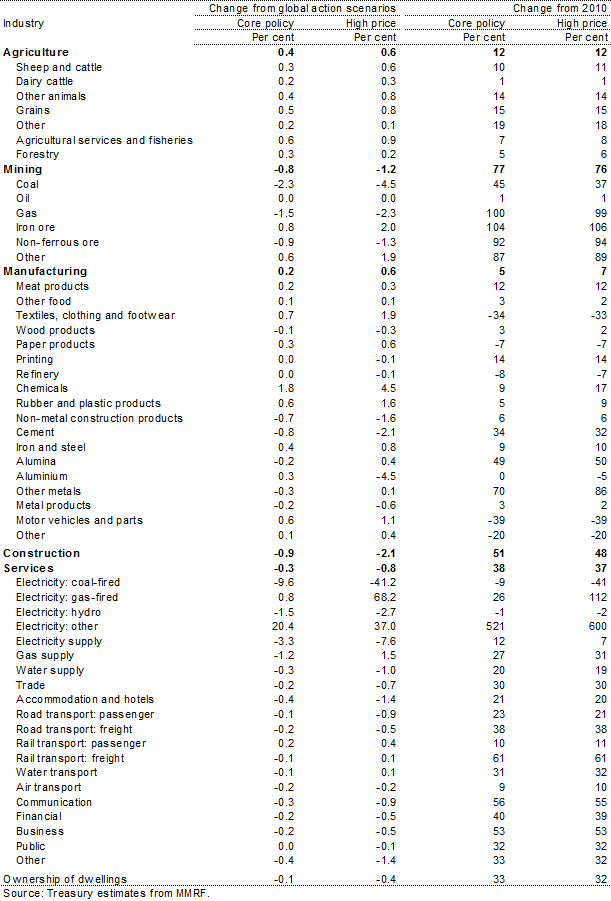
Table 5.7: Gross output, by industry, 2050
Source: Treasury estimates from MMRF.
Table 5.8: Employment share, by industry, 2020
Source: Treasury estimates from MMRF.
Table 5.9: Employment share, by industry, 2050
Box 5.4: Manufacturing abatement technology
Emission reductions depend partly upon the take up of cleaner production processes and technologies. Some technologies are already available but adoption is not economic without carbon pricing, such as scrubbers to reduce nitrous oxide emissions in ammonium nitrate production; others are at an early stage of development and may or may not prove cost effective on an industrial scale, such as HIsarna steelmaking technology. Of course, how fast efficiency improvements become available, and at what cost, remains uncertain.
The modelling makes assumptions about the marginal cost of abatement opportunities in industrial processes and fugitive emissions from mining. (See Appendix B.) The take up of these opportunities depends on the carbon price, and for a given carbon price, the modelling assumes it takes some time for firms to change production processes. Higher carbon prices result in larger reductions in emission intensity — the volume of emissions produced per unit of output.
The particular assumptions made about abatement opportunities have little effect on industry growth rates because the change in production processes is assumed to be cost neutral. That is, the take up of new technology is costly, offsetting the savings in carbon costs. However, different assumptions affect the amount of domestic abatement achieved, and hence, the amount of abatement sourced from overseas.
Large changes in the assumptions only slightly change the estimated effects of carbon pricing on GNI. For example, were abatement opportunities in manufacturing more costly, so that only half the reduction in the emission intensity of production was achieved in 2050, then domestic emissions would be higher by around 9 Mt CO2-e, and the estimated impact of carbon pricing on the level of GNI in 2050 would be larger by only 0.04 percentage points.
Box 5.5: Assistance to emission-intensive trade-exposed activities
Emission-intensive trade-exposed (EITE) activities are affected by domestic and international carbon pricing. International carbon pricing makes Australian emission-intensive industries more competitive, while domestic carbon pricing rebalances that effect. Coordinated global mitigation efforts would help ensure Australia's comparative advantage reflects actual differences in the emission intensity of production across countries.
The Government's transitional assistance to firms assessed as emission intensive and trade exposed supports the transition to a carbon-constrained economy. The assistance ensures firms face a strong incentive to reduce emissions.
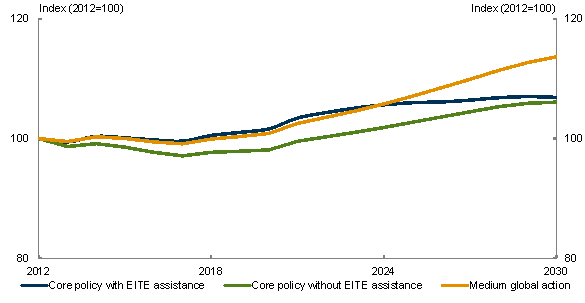
Modelling results show this transitional assistance will support output in emission-intensive industries. Output remains as high as, or higher than, it would be in the medium global action scenario without domestic carbon pricing. The modelling assumes comparable carbon pricing in other major economies from 2015-16, and the phase out of transitional assistance over five years starting in 2022.
The assistance also slows the transition of resources, including employment, from these sectors to other parts of the economy, and redistributes costs from shielded to unshielded sectors. In the long term, this transition is necessary to achieve Australia's emission targets at lowest cost.
Chart 5.15: Output in seven emission-intensive industries
Alumina, aluminium, cement, chemicals, refinery, paper and steel
Source: Treasury estimates from MMRF.
Table 5.10: Gross output, by sector, 2020
Change from 2010 to 2020

Table 5.11: Gross output, by sector, 2050
Change from 2010 to 2050

5.4.2 Differences within sectors
While the overall effects by broad sector are small, the effects on individual industries vary widely. Relative carbon intensity affects how industries respond to pricing carbon. For example, pricing of fugitive emissions in coal and gas production slows their output and export growth. This tends to lower Australia's exchange rate, making other trade-exposed industries more competitive. Slower productivity growth in carbon-intensive sectors slows growth in wages and costs of production in other parts of the economy. Other industries grow faster, if they are outside the scope of carbon pricing, engage in assisted emission-intensive trade-exposed activities or have relatively low carbon intensity.
Agricultural activity emissions are assumed to be excluded from carbon price coverage in both policy scenarios. The carbon intensity of agriculture, forestry and fishing ranges from potentially negative in forestry, to relatively low in grain production, through to highly emission-intensive sectors such as cattle grazing. As agricultural output is traded, the industries gain a competitive advantage from lower wages and exchange rates in the carbon pricing scenarios, and all parts of the sector grow more rapidly.
Carbon pricing affects different parts of the mining sector differently. Energy extraction industries grow less rapidly due to higher costs of extraction, associated with fugitive emissions, and weaker demand due to the cost of combusting coal and gas domestically. Other parts of the mining sector are less affected and some, such as iron ore mining, grow faster with a carbon price than without. Overall, the mining industry maintains very strong growth with a carbon price over the decade ahead, but grows more slowly over later decades.
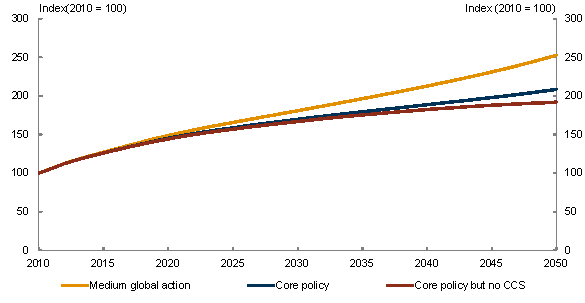
The expansion of Australia's coal industry will be affected by the development of carbon capture and storage technology (CCS). Carbon capture and storage starts in the mid 2030s in the core policy scenario and in the mid 2020s in the high price scenario. Without this technology, Australia's coal production would grow by 92 per cent over the period to 2050, instead of 109 per cent in the core policy scenario. Without the development and take up of CCS, domestic emissions would be higher by around 25 Mt CO2-e in 2050 and the estimated impact of carbon pricing on the level of GNI would be larger by 0.2 percentage points in 2050.
Chart 5.16: The effect of carbon capture and storage on coal production
Note: Projections incorporate electricity sector modelling by SKM MMA.
Source: Treasury estimates from MMRF.
Construction sector output varies in line with demand for infrastructure and non-residential buildings from the mining sector, and so follows a similar pattern to that sector.
Some parts of the manufacturing sector grow faster, and some parts grow more slowly, with carbon pricing. Overall, the effect on manufacturing output is small. Some emission-intensive sectors such as iron and steel production, alumina and aluminium refining grow more slowly with a carbon price after the assumed phasing out of assistance to emission-intensive trade-exposed activities. On the other hand, many other less emission-intensive industries, including printing; textiles, clothing and footwear; motor vehicle and part manufacturing; and food manufacturing, are more competitive, growing faster with domestic carbon pricing than in the global action scenarios.
Services continue to grow strongly and their economy-wide share of employment is higher than current levels. Service-oriented sectors tend to be low emission intensive, except waste, which forms part of the other services industry. Carbon pricing excludes emissions from legacy waste, but pricing emissions from new waste reduces growth in the sector.
5.4.3 Electricity generation
Electricity generation accounts for the largest share of Australia's current emissions, so Australia's transition to a low-emission future requires a significant transformation in this sector. Australia has a range of options available to assist with this transition, including gas, wind, solar and geothermal resources. Furthermore, Australia's coal resources could play an important role in an emission-constrained world if carbon capture and storage technology proves commercial.
The modelling shows that introducing a carbon price changes the composition of electricity generation in Australia. The carbon price drives significant changes in the mix of technologies and fuels used in the electricity sector in both policy scenarios. Demand for electricity is also an important source of abatement in the early years of the electricity sector's transition to a cleaner future.
Generation from renewable technology is significantly higher in both policy scenarios. Initially, most renewable generation that comes online is wind generation; later this is overtaken by geothermal energy which becomes a major source of renewable generation. Gas also becomes an important component of Australia's generation mix, increasing across all policy scenarios. The extent of switching towards gas-fired generation depends on future gas prices and availability of alternative, cleaner technology, such as coal carbon capture and storage.
Electricity demand
In all sectors, electricity demand falls relative to the global action scenarios after a carbon price is introduced. Increasing electricity prices drive changes in electricity consumption. This occurs through both substitution by households and firms to more efficient consumption choices and production processes, and through restructuring of the economy towards less electricity-intensive industries. There is already evidence of reducing consumption of electricity by households in response to recent electricity price rises.1
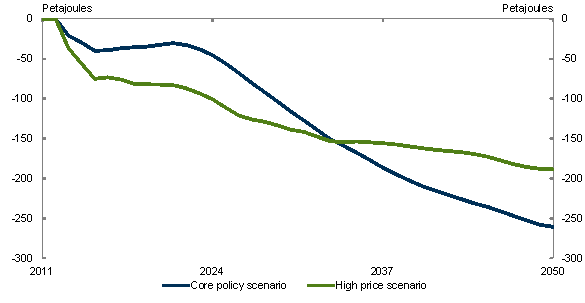
In 2050, electricity demand is around 17 per cent lower than the global action scenarios in the core policy scenario and 12 per cent lower in the high price scenario.
Towards 2050, electricity demand is greater in the high price scenario, driven by stronger demand from the transport sector. The higher carbon price, combined with the broader coverage of the transport sector in the high price scenario, drives a much larger shift to electric vehicles.
Chart 5.17: Electricity demand
Change from global action scenario
Source: Treasury estimates from MMRF, SKM MMA and ROAM.
Transformation of the electricity sector
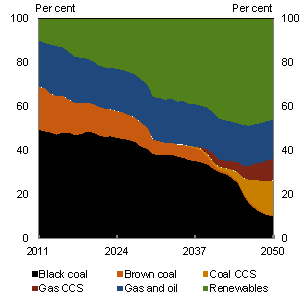
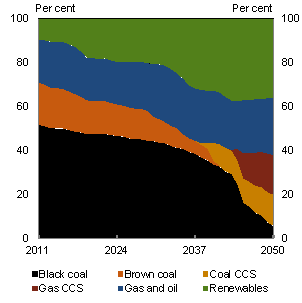
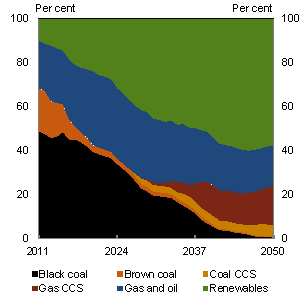
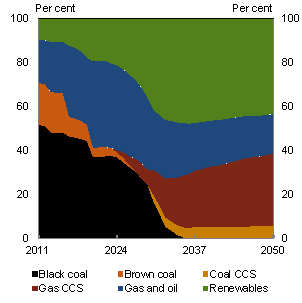
A carbon price drives significant changes in the mix of technologies and fuels used in the electricity sector in both policy scenarios. A carbon price makes gas and renewable energy sources more competitive relative to coal, leading to a progressive transition away from conventional coal-fired generation. However, coal continues to play an important role in electricity generation, particularly following the adoption of carbon capture and storage.
The high price scenario drives a far quicker transformation of the electricity generation sector, with gas and renewables together contributing over 75 per cent of the generation mix by 2050.
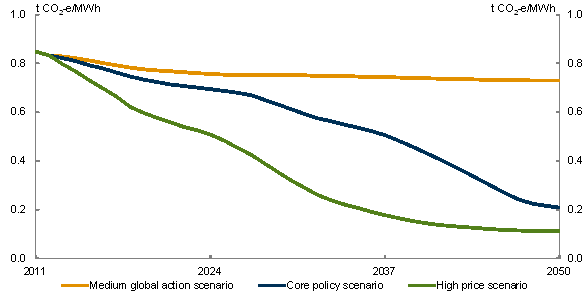
Transforming the fuel and technology mix reduces the emission intensity of electricity supply. While electricity demand falls in the policy scenarios compared with the global action scenarios, most emission reductions are through reduced emission intensity over the longer term. Across the policy scenarios, emission intensity is projected to improve by over 75 per cent by 2050.
Chart 5.18: Emission intensity of electricity generation
Source: Treasury estimates from MMRF, SKM MMA and ROAM.
Chart 5.19: Sources of electricity generation
SKM MMA
Core policy scenario
ROAM
Core policy scenario
High price scenario
Source: SKM MMA; and ROAM
High price scenario
Coal
Coal-fired electricity declines as a share of total generation across all scenarios after carbon is priced. In particular, cleaner sources replace generation from the most emission-intensive generators. However, rising gas prices help coal-fired electricity remain competitive for baseload generation.
No new commercial-scale coal-fired power stations without CCS are approved and commissioned in Australia once the carbon price is introduced. The exception is under one scenario modelled by ROAM. Assuming the world is still in a 550ppm scenario in 2030, ROAM predicts that one supercritical black coal plant will open in Western Australia at that time.
Sensitivity analysis suggests that higher coal prices would result in marginally higher wholesale prices and negligible impacts on the sources of generation.
Renewables
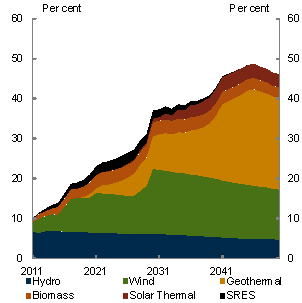
As in the global action scenarios, an increase in renewables driven by the large scale renewable energy target (LRET) satisfies most growth in demand to 2020. Renewable generation reaches 20 per cent of total generation by 2020 in the core policy scenario and between 21 and 26 per cent of total generation by 2020 in the high price scenario. This includes renewable generation driven by the small renewable energy scheme (SRES).
Chart 5.20: Renewables by technology — share of total generation
Core policy scenario
SKM MMA
ROAM
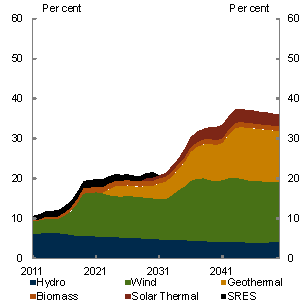
Note: ROAM provided estimates of generation from the SRES for the life of the program (to 2030). SKM MMA estimates also cover the ongoing effects of the program beyond 2030.
Source: SKM MMA and ROAM.
The relatively small additional increase in renewable generation in 2020 under the policy scenarios is the result of offsetting impacts of carbon pricing on the revenues of renewable generators. Increased wholesale prices under carbon pricing deliver higher revenues to renewable generators and increased investment in renewables. However, the increased supply of renewable energy certificates from additional renewable capacity also reduces the price for these certificates, offsetting to some extent the revenue benefits of higher wholesale prices.
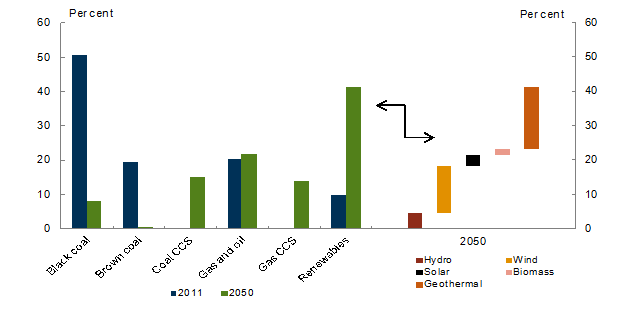
Renewable generation continues to grow strongly to 2050, to around 40 per cent of total generation in the core policy scenario and around 50 per cent in the high price scenario.
The early increase in renewables is largely driven by increased wind generation. However, over time, other renewables become increasingly competitive. By 2050, geothermal is a major source of renewable generation, accounting for between 13 per cent (ROAM) and 23 per cent (SKM MMA) of total generation in 2050.
Intermittent generators such as wind produce less generation per unit of capacity on average, than other generators. As such, the higher proportion of intermittent wind generation in ROAM modelling requires the installation of a greater amount of total generation capacity, particularly additional gas generation capacity.
Chart 5.21: Renewable generation
Core policy scenario
Source: Average of SKM MMA and ROAM.
Chart 5.22: Renewable generation
High price scenario
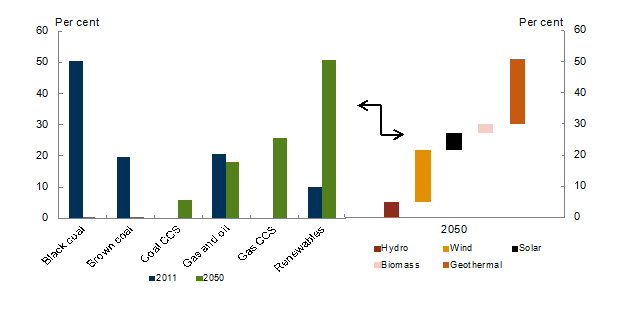
Source: Average of SKM MMA and ROAM.
Sensitivity analysis suggests that lower costs for renewables would result in around 10 per cent more renewable generation in 2050 and 5 per cent lower emissions. Electricity prices would also be lower.
Gas
The outlook for gas generation depends heavily on the combined effect of lower electricity demand, rising gas prices and the carbon price. Gas remains an important component of Australia's generation, remaining around current levels over the next 15 years. However, in the core policy scenario it increases over 200 per cent by 2050.
The modelling suggests a carbon price of around $60 per tonne is sufficient to drive significant increases in gas generation in the near term.
Increased gas-fired generation is projected, despite domestic gas prices more than doubling by 2050. This is partly because gas generation plays an important role as a back-up for renewable generation, such as wind, during peak periods of demand.
Sensitivity analysis shows that lower gas prices result in far greater gas-fired generation over the longer term and a significant fall in cumulative emissions (between 10 and 20 per cent lower to 2050). Cumulative emissions fall because gas-fired generation replaces coal-fired generation which has a higher emission intensity.
Chart 5.23: Gas-fired electricity generation
Increase from today's level
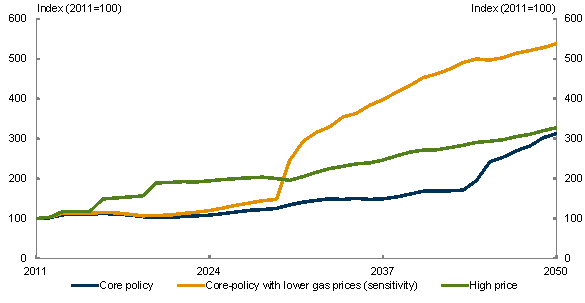
Source: Average of SKM MMA and ROAM.
Carbon capture and storage
Carbon capture and storage (CCS) is a technology that can reduce emissions from a range of activities, including the combustion of fossil fuels (oil, gas and coal) for electricity generation. CCS involves capturing emissions, compressing them, transporting them to a suitable site and storing them permanently deep underground.
The longer term role for coal in electricity generation depends in part on the development and deployment of CCS technology. In the core policy scenario, CCS does not become viable until the 2030s.
In the high price scenario, CCS becomes viable in the mid 2020s and grows to around 30 per cent of total generation in 2050 (average of SKM MMA and ROAM). Gas is the predominant form of CCS technology, as it is less emission intensive than coal CCS.
Table 5.12: Carbon capture and storage, estimated deployment year and carbon price

Source: SKM MMA; and ROAM.
Sensitivity analysis shows that if CCS does not become viable, gas will provide additional generation in place of CCS generation. This results in higher emissions and electricity prices, mainly after 2040.
Of course, the further out into the future one looks, the greater the uncertainty. It is possible that other technologies may develop, so the absence of CCS could have little impact in the longer term.
New investment
In the core policy scenario, over $200 billion in new generation investment is required between now and 2050. This includes around $50-$60 billion in gas, $100 billion in renewables, and around $45-$65 billion in coal, nearly all of which is for CCS plants.
Table 5.13: Cumulative investment in new generation capacity

(a) ROAM figure also includes $1.4 billion in capital expenditure on a supercritical black coal plant in Western Australia in 2030 and 2031.
Source: SKM MMA; and ROAM.
Electricity generation emissions
The electricity sector is the largest source of emission reductions, delivering over 40 per cent of total abatement over the period to 2020 in the core policy scenario.
The reduction in emissions occurs in two phases. Initially, abatement is driven by slower growth in demand and switching from existing high emissions generation towards existing lower emission generation, particularly wind. As the carbon price rises, newer technologies such as CCS and geothermal become commercially competitive with existing technologies, driving further reductions in emissions.
Instead of emissions growing by over 60 per cent in 2050 in the global action scenarios, emissions decline by around 60 per cent in the core policy scenario.
Electricity demand provides an important source of abatement in the early years of the sector's transition to a cleaner future. Reduced demand delivers almost half of the cumulative abatement to 2020 in the core policy scenario. If electricity was shielded from a carbon price, electricity emissions would remain at around current levels until the late 2020s in the core policy scenario.
Chart 5.24: Electricity sector emissions
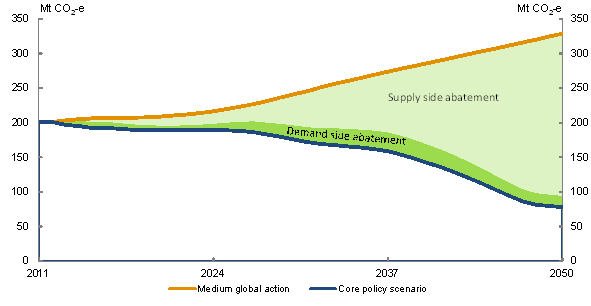
Source: Treasury estimates from MMRF, SKM MMA and ROAM.
Emission reductions vary with different carbon prices and between different modellers. Over time, the abatement projected by both modellers is fairly similar, with abatement increasing significantly after 2020 in the core policy scenario.
Chart 5.25: Electricity sector abatement
SKM MMA
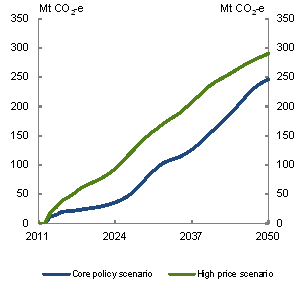
ROAM
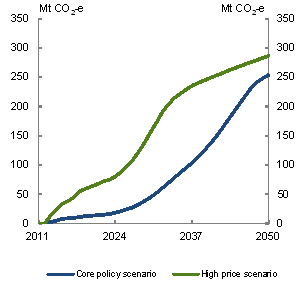
Source: Treasury estimates from MMRF, SKM MMA and ROAM.
The accelerated change in emissions in the high price scenario in ROAM modelling is the result of faster retirement of the existing coal-fired generation fleet. This significantly lowers the average emission intensity of the sector around this time.
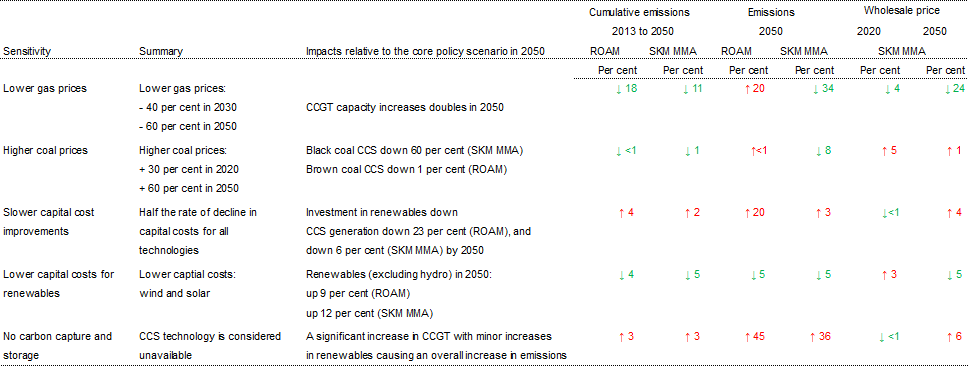
Sensitivity analysis shows that the emission estimates are robust to a range of different assumptions. Adopting more conservative assumptions, such as CCS not becoming available or slower technological improvements, increases cumulative emissions by less than 5 per cent between 2013 and 2050. Conversely, assumptions such as lower gas prices and cheaper renewable technologies could result in cumulative emissions between 3 and 19 per cent lower than projected between 2013 and 2050.
Chart 5.26: Electricity sector emissions — sensitivity analysis
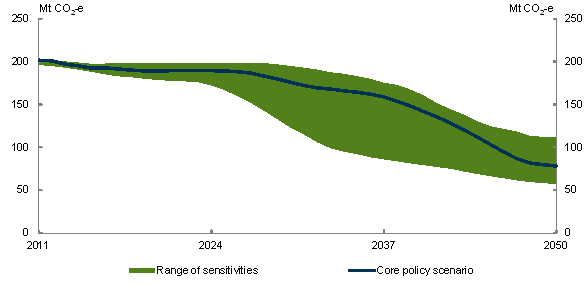
Source: Treasury estimates from SKM MMA and ROAM.
Wholesale electricity prices
As previously outlined, without a carbon price wholesale electricity prices rise strongly to 2030, driven by rising gas prices and new, higher capital cost plants entering the market to meet growing demand.
The two modellers present different wholesale price increases, with higher costs for baseload capacity in ROAM's modelling leading to higher wholesale prices.
The cost of carbon pricing in the core policy scenario on existing fossil fuel power plants flows into electricity prices, making Australian wholesale electricity prices around $18 per MWh higher on average over the first five years. Deployment of cleaner, more expensive technologies causes electricity prices to continue to increase.
Wholesale electricity prices are sensitive to assumptions about energy commodity prices and capital costs. Changes in the prices of coal and gas have an immediate impact on electricity prices. In contrast, changes in the capital costs of new generators have a greater impact over time, as new generation capacity is required.
Chart 5.27: Average wholesale electricity prices
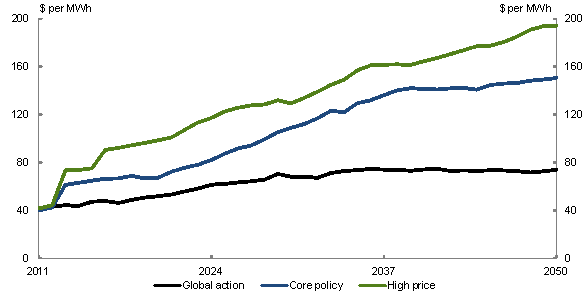
Note: Prices are in 2010 dollars. Global action is the average of medium and ambitious global action scenarios.
Source: Average of SKM MMA and ROAM.
Table 5.14: Average wholesale electricity price increases
Change from global action scenario (per cent)

Note: Prices are in 2010 dollars.
Source: Average of SKM MMA and ROAM.
Household electricity prices
Higher wholesale electricity prices flow into retail prices paid by households. Household retail electricity prices are projected to increase by 10 per cent on average, compared to the global action scenario, over five years after carbon pricing starts. The percentage impact is lower than for wholesale prices, as wholesale prices form only part of total retail prices.
Previous Treasury climate change mitigation modelling projected a 20 per cent increase over the period 2010 to 2015. The projected increase is now lower largely due to higher retail prices in the global action scenario. This reflects strong growth in network costs to pay for upgrades of existing infrastructure.
Chart 5.28: Household electricity prices
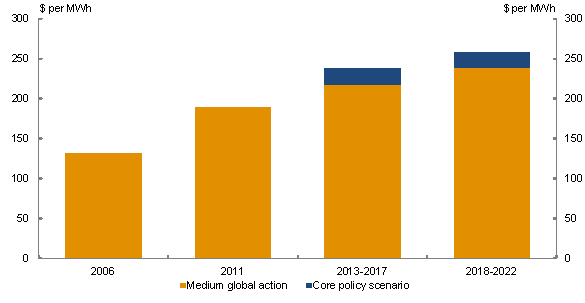
Note: Prices are in 2010 dollars.
Source: Average of SKM MMA and ROAM.
Table 5.15: Average household electricity price increases
Change from global action scenario (per cent)

Note: Prices are in 2010 dollars.
Source: Average of SKM MMA and ROAM.
Profits of existing generators
The extent to which carbon costs incurred by generators translate into general increases in electricity prices depends on the carbon cost pass-through. The degree of pass-through under a carbon price depends on a range of factors, including electricity demand and costs of alternative fuels, such as gas. The impact on an individual generator's profits is determined by the increase in its costs under a carbon price (higher for more carbon intensive generators) and the rate of carbon cost pass-through in the market.
Individual generator profits would also be affected by any assistance provided by the Government to generators. However, no generator assistance was assumed for the purposes of assessing impacts on profits, or for the modelling more broadly.
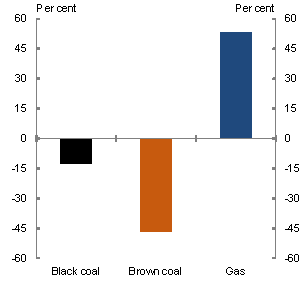
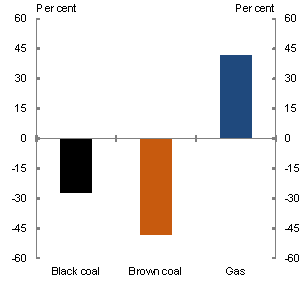
Both modellers show that profits for all brown coal generators decline in the core policy scenario. ROAM modelling also shows that profits decline for all black coal generators, though results vary from around $1 billion to as low as $9 million. 2 Declining profits for brown and black coal generators are partially offset by increased profits for lower emission generators, such as gas.
Gas and hydroelectric generators can benefit from increased wholesale prices if their carbon costs are lower than the increase in wholesale prices from the carbon price. Both SKM MMA and ROAM modelling show losses for coal generators but increases in profits for some lower emission generators.
ROAM results generally show higher losses than SKM MMA for coal generators, largely due to higher profits in the global action scenarios. This is driven by higher wholesale prices in the ROAM global action scenario, and consequently higher cash flows for existing generators.
Chart 5.29: Impact of a carbon price on profits of existing generators
Per cent change from the medium global action
SKM MMA
ROAM
Source: SKM MMA; and ROAM.
The impact of carbon pricing on generator profits will depend on a range of factors. These include the cost structures of individual generators, the extent of demand growth, the costs of new electricity generation technologies and fuel prices.
Higher future wholesale prices, driven by higher gas prices or more expensive future capital costs, would increase the profits of existing coal generators. Conversely, lower capital costs of low emission generators would decrease the profits of coal fired generators, as would lower gas prices.
Box 5.6: Carbon cost pass-through
For the most emission-intensive generators, typically brown coal generators, carbon costs per unit of generation will be higher. How much of the carbon cost individual generators can recoup depends on how much electricity prices increase in each market. The emission intensity of the marginal generator at different times through the day and over the year largely determines this. If the marginal generator is less emission intensive than a particular generator, this compresses the margins of that generator, reducing its profits.
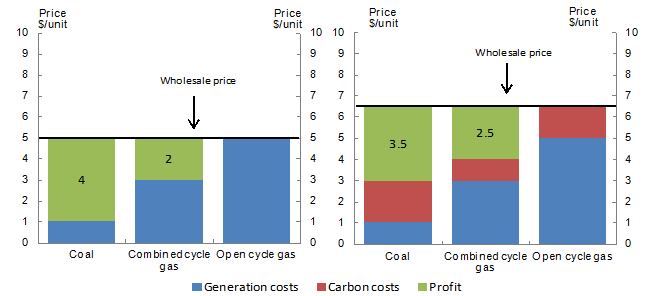
The carbon price pass-through varies between SKM MMA and ROAM, partly due to different assumptions about the emission intensity of the marginal generator at particular points in time. The carbon price pass-through is similar for the two modellers in the first five years of a carbon price (with each dollar of the carbon price adding around 85 cents to wholesale electricity prices) but falls more rapidly in ROAM's modelling over the subsequent five years due to a greater reliance on gas fired generation.
Chart 5.30: Carbon price pass-through — stylised example
Source: Treasury.
The stylised example shows carbon price pass-through to wholesale prices during periods of peak demand. In this example, before a carbon price, open cycle gas is the marginal generator and sets the market price. Coal generators have the lowest cost of generation and therefore make the largest profits, with combined cycle gas also making profit (but less than coal).
Once a carbon price is introduced, open cycle gas remains the marginal generator and passes through all its carbon costs, increasing wholesale prices. Its profit is unchanged. Due to their higher emission intensity, coal generators pay a higher carbon price per unit of generation and their profit is reduced. Combined cycle gas has the lowest emission intensity, faces the lowest carbon cost and as a result, increases profitability.
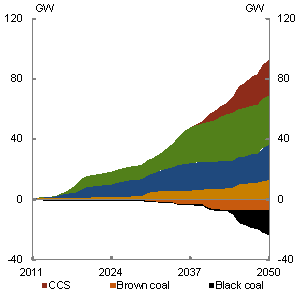
Retirement of existing power plants
As with other industries, a carbon price will affect the economics of existing power generators. Emission-intensive brown and black coal generators will find the additional cost of the carbon price reduces their profitability and some may retire. Conversely, a carbon price will make existing lower emission generators, such as renewable and gas generators, more profitable.
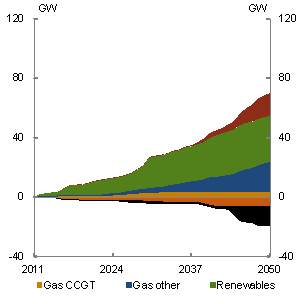
The core policy scenario suggests early closure of the most emission-intensive brown coal power stations and a reduced reliance on black coal generators. It also shows investment in renewables, various gas technologies and after around 2040, CCS technology, more than offsets lost generation capacity as coal plants retire.
Nonetheless, the modelling also shows great uncertainty around the timing of retirement. Potential closure of assets depends on the prospects for wholesale electricity prices, with higher prices enabling incumbent generators to pass on carbon costs for longer before becoming unviable.
Chart 5.31: Changes in generation capacity by fuel type
SKM MMA
ROAM
Source: SKM MMA; and ROAM.
Despite this uncertainty, electricity prices adjust to ensure either existing or new generators can operate profitably while meeting electricity demand in each policy scenario.
This report projects retirement of electricity generation units by modelling them as economic assets requiring a commercial rate of return. It does not take account of financial considerations, such as debt-equity ratios or ownership structures, on retirement decisions. These may be interrelated. However, a profitable asset is likely to continue operating with existing owners or sold to new owners.
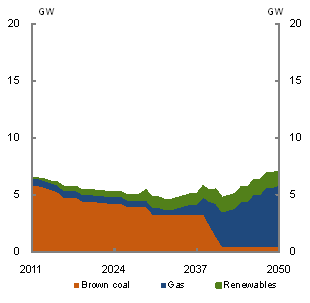
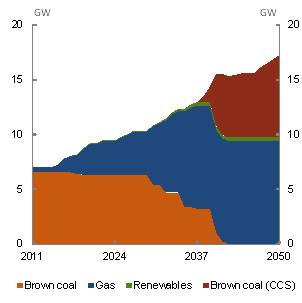
The Latrobe Valley remains an important energy exporting region, even as existing coal plant is retired. The Latrobe Valley has significant transmission and distribution networks, making it ideal for investment in new and cleaner energy sources. Both modellers show more generation capacity located in the Latrobe Valley in 2050 than today, despite the eventual retirement of all existing emission-intensive brown coal generators. However, the results of the modellers vary considerably in the timing of retirements, and the composition and timing of new generation capacity.
Chart 5.32: Generation capacity in the Latrobe Valley/Gippsland region
SKM MMA
ROAM
Source: SKM MMA; and ROAM.
Sensitivity analysis
Given the uncertainty around future commodity prices, technological progress and capital costs, a number of sensitivity scenarios were conducted to test the implications of changes to the assumptions. The analysis shows that the projections are generally robust to changes in the assumptions, with only minor changes to the projections in most sensitivity scenarios.
Aside from the alternate assumptions outlined below, the sensitivities are based on the assumptions adopted in the core policy scenario, such as electricity demand.
Table 5.16: Implications of sensitivity analysis
Source: SKM MMA; and ROAM.
5.4.4 Transport
Despite continued growth in transport activity across the economy, carbon pricing results in lower emissions in the transport sector. Transport delivers between 8 and 11 per cent of total domestic abatement out to 2050, with the road transport sector providing the vast majority of abatement.
The core policy scenario assumes all passenger and light commercial vehicles, all vehicles engaged in agriculture and fishing, and all vehicles using LPG and natural gas are excluded permanently from carbon pricing impacts. All other road freight vehicles are included from 2014-15.
In contrast, the high price scenario includes passenger vehicles, vehicles engaged in agriculture and fishing, and gas fuelled vehicles from 2015-16, while business vehicles and vehicles using natural gas are included from 2013-14. Once included, passenger vehicles face only the incremental increase in the carbon price over time, while other sectors face the full carbon price once included.
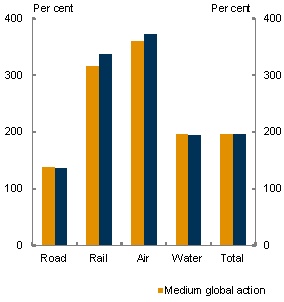
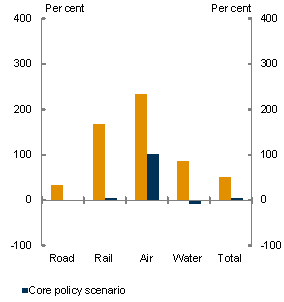
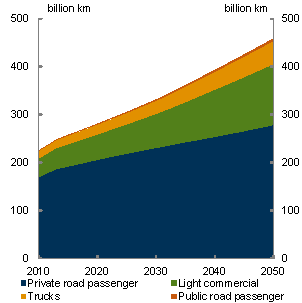
Transport activity is projected to be relatively unaffected by carbon pricing. Growth in activity remains similar across most sectors, though there is some substitution from road transport to rail. Air transport activity is stronger in the carbon price scenarios, as the benefits of a lower exchange rate for exports outweigh reduced domestic consumption of air transport.
Chart 5.33: Transport activity and emissions
Activity growth to 2050
Emissions growth to 2050
Source: Treasury estimates from MMRF and CSIRO.
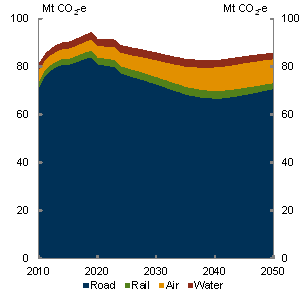
Across the policy scenarios, total transport emissions range from 30 to 70 per cent below levels without a carbon price by 2050. Emissions continue to grow over the next ten years before falling back towards current levels by 2050. The higher level of abatement in the high price scenario reflects both the higher carbon price and broader coverage of road transport.
Chart 5.34: Emissions and activity, core policy scenario
Transport emissions
Road transport activity
Source: Treasury estimate from MMRF and CSIRO.
Road transport
While there is a small reduction in road transport activity from the introduction of a carbon price, the majority of abatement comes from changes in fuel use.
Table 5.17: Emissions and abatement by carbon price scenario

Source: Treasury estimates from MMRF and CSIRO.
There is limited abatement in the near term due to the time required to turn over the existing vehicle fleet and the higher upfront costs of cleaner technologies. However, from 2020, road transport emissions fall substantially relative to the global action scenarios. Cumulatively, road transport contributes around 6 per cent of total domestic abatement out to 2050 in the core policy scenario.
Emissions from rigid trucks in 2050 are around 75 per cent below 2010 levels. Passenger vehicle emissions fall to nearly 30 per cent below today's levels, while emissions from articulated trucks, buses and light commercial vehicles increase, but at a slower rate than in the global action scenarios.
Continuing the trends in the global action scenarios, a carbon price drives even greater changes in the fuel mix over time, with greater adoption of alternative fuels.3
Chart 5.35: Road transport fuel mix
Heavy vehicles
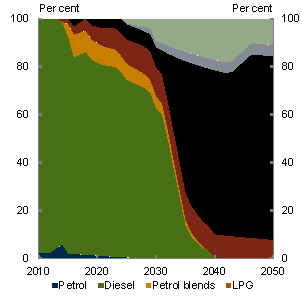
Light vehicles
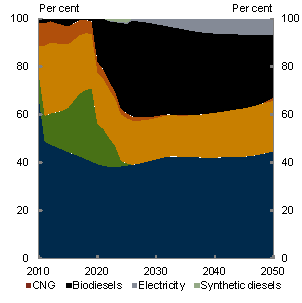
Note: Biodiesels are B20, pure biodiesel and biomass-to-liquid. Synthetic diesels are coal-to-liquid and gas-to-liquid.
Source: CSIRO.
The most significant change in fuel mix is the adoption of biodiesel blends. By 2030, biodiesels become the dominant fuel used in heavy vehicles and represent more than 75 per cent of total fuel use by 2050.
There is also increased uptake of electric vehicles and synthetic diesels, although these remain fairly small shares of the overall fuel mix. The uptake of electricity among heavy vehicles is confined to rigid trucks and buses, as it is unsuitable for use in long haul transport. Higher carbon prices and carbon capture and storage make synthetic fuels more attractive.
Changes in transport fuels and technologies driven by heavy vehicle demand are also projected to provide spillover benefits to light vehicle users. In particular, strong heavy vehicle demand aids the development of the biofuels industry. This leads to cheaper and more widely available biofuels for light vehicles. Similarly, as heavy vehicle demand drives the development of the infrastructure required for electric vehicles, this will encourage the uptake of light electric vehicles. Nevertheless, conventional petrol remains the dominant fuel used in light vehicles.
5.5 State analysis
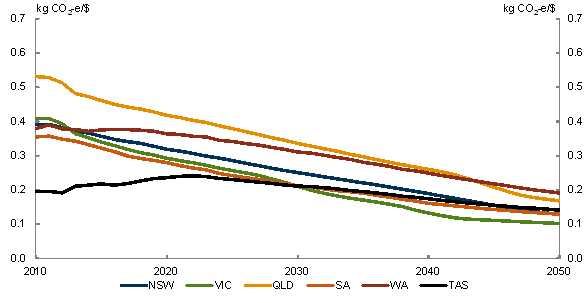
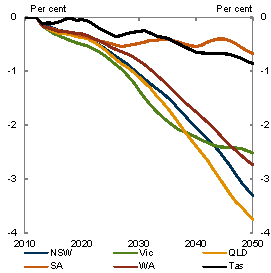
All states are projected to continue to prosper while reducing their emission intensity of output.
The impact of carbon pricing on gross state product (GSP) depends on each state's emission intensity, which in turn depends on its industry structure. To the extent the carbon price affects the exchange rate, the state's trade intensity also matters.
Chart 5.36: Emission intensity by state
Core policy scenario
Source: Treasury estimates from MMRF.
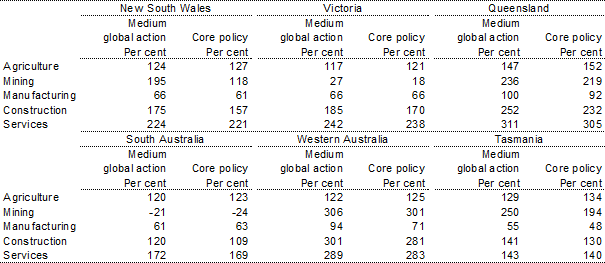
South Australia, Tasmania and Victoria face more modest carbon pricing impacts than the national average. They are less emission intensive due to a greater concentration of industries, such as motor vehicles and parts production, textiles, clothing and footwear, and forestry, which grow somewhat faster with carbon pricing.
Queensland, Western Australia and New South Wales have more emission-intensive industrial structures, relying somewhat more on emission-intensive manufacturing, such as iron and steel production, alumina and aluminium production and petroleum refining, and energy extraction. For example, exports of liquefied natural gas from Western Australia and Queensland grow strongly with carbon pricing, but production growth may slow with a carbon price in the 2030s and 2040s. Similarly, while output of the black coal industry in New South Wales will continue to grow, the rate of output growth will be somewhat slower with carbon pricing.
It is difficult to quantify the impact of carbon pricing at a sub-state regional level due to limitations on the level and quality of data available. Over time, carbon pricing will encourage resources to move between regions, but reliable information on which to project these movements is not available.
Chart 5.37: Gross state product
Core policy scenario
Level
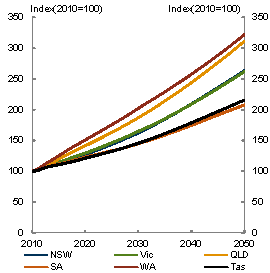
Change from global action scenario
Source: Treasury estimates from MMRF.
Table 5.18: Output by industry and state
Growth from 2010 to 2050
Source: Treasury estimates from MMRF.
5.6 Households
Aggregate household consumption will continue to grow with carbon pricing. Households face higher prices for emission-intensive products, such as electricity and gas used for heating, but most other products, including food and clothing, will see only minimal price increases. Impacts on individual households will depend on the specific goods and services they typically consume and how easily they can change their consumption in response to price changes.
5.6.1 Effects on aggregate household income
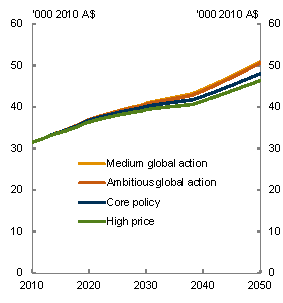
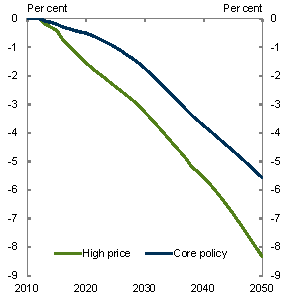
Household consumption continues to grow strongly over time in both policy scenarios. Real household consumption per person grows at an average annual rate of 1.1 per cent in the core policy scenario, compared with 1.2 per cent in the global action scenario.
Private consumption moves in line with household income growth, which slows mainly due to slower growth in labour income. The modelling assumes that net permit revenue is returned to households, which partially offsets the effect of slower growth in labour income.
Chart 5.38: Private per person consumption
Level
Change from global action scenario
Source: Treasury estimates from MMRF.
5.6.2 Effects on consumer prices
While average consumption levels continue to grow, carbon pricing changes the relative prices of high and low emission-intensive goods and overall consumer prices increase.
To help households with the move to a low carbon economy, the Government will provide assistance through increases in the Family Tax Benefit, pensions and allowances as well as tax cuts. This will ensure that households are provided with support as Australia moves to a clean energy future.
The analysis in this section overstates the effect of carbon pricing on the average level of consumer prices. It assumes emission costs to households are passed on fully, based on fixed consumption patterns. The true change in the average household cost of living is likely to be lower than the estimate here, as households substitute towards lower emission goods and services. Changes in consumption will start to have some effect immediately after the introduction of carbon pricing and become more important over time. The dynamic general equilibrium modelling accounts for these changes over time, allowing for households to adjust spending in response to changes in relative prices. That modelling projects that around one-half of the increase in prices of emission-intensive goods and services is offset by lower consumption of those products. The effect on average consumer prices also is likely to be overstated because it assumes production technology is not adjusted. Firms will move to less emission-intensive technology and substantially reduce the carbon intensity of the economy, but these changes will take time.
Chart 5.39: CPI impact from carbon pricing compared with history
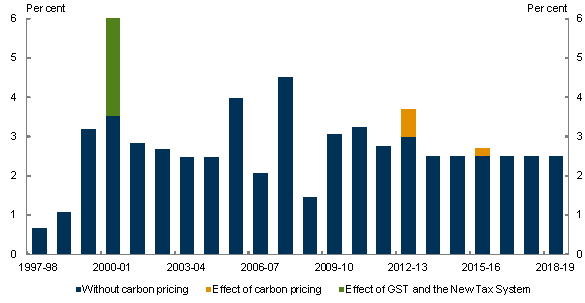
Source: Treasury calculations from ABS.
Most of the effect on consumer prices occurs in the first year of the fixed price period. Overall consumer prices increase by 0.7 per cent in 2012-13 under a $23 carbon price. On average, household spending is expected to increase by less than $10 per week. The consumer price impact on different goods depends on the emissions intensity of their production. Household expenditure, on average, is expected to increase by $3.30 per week due to higher electricity prices and by $1.50 per week due to higher gas prices. Most items in consumer budgets will increase by less than 1 per cent, such as food where households are expected on average to spend only an additional $0.80 per week. These effects are small compared with the effect of the new tax system introduced in July 2000, which raised consumer prices by 2½ per cent. They are also small in the context of historical movements in consumer prices from year to year.
By 2015-16, with the transition to a flexible price cap-and-trade scheme with a world carbon price projected to be around A$29, it is estimated that carbon pricing will have raised the level of consumer prices by a further 0.2 per cent, for a total effect of 0.9 per cent. By 2015-16, households, on average, would spend around $13.40 per week more in the core policy scenario if they made no changes in their consumption patterns following the introduction of carbon pricing. Of course, the actual world price in 2015-16 may be lower or higher, resulting in different effects on consumer prices. Beyond 2015-16, carbon pricing is not expected to have a material impact on inflation.
Table 5.19: Effects on weekly expenditure and the consumer price

Note: The dollar per week impacts are the average across households, not the impact on an average household. Effects on weekly expenditure are in 2012-13 dollars.
Source: Treasury estimates based on PRISMOD.
5.6.3 Distributional effects
Changes in consumer prices affect different households in different ways. The distribution of these effects depends on the initial emission intensity of consumption by different household types and their relative ability to alter their consumption.
Low income households are disproportionately affected by carbon pricing. They spend, on average, a higher proportion of their disposable income on emission-intensive goods, such as electricity and gas. For this reason, the average price impact for a single pensioner household in the lowest income quintile is estimated to be 1.0 per cent in 2012-13, while for a one-income household with no children in the highest income quintile the average price impact is estimated to be 0.6 per cent.
As outlined above, estimates of the impact of carbon pricing on average consumer prices are overstated because they ignore the ability of households to substitute towards lower emission products. The degree of overstatement is likely to be greatest for higher income households, as they are more able to shift consumption towards less emission-intensive goods through product substitution. Households that can change their consumption patterns will face lower price impacts than households that cannot do so.
These estimates do not incorporate the Government's commitment to provide financial assistance to households. Households will receive assistance, which they will be able to pocket if they transfer consumption to less emission-intensive goods to improve their energy efficiency.
Table 5.20: Estimated price impacts by household type
$23 carbon price in 2012-13
|
|
Household income quintile (a) | |||||
|---|---|---|---|---|---|---|
| Household type and primary source of income | All | First quintile | Second quintile | Third quintile | Fourth quintile | Fifth quintile |
| Per cent | Per cent | Per cent | Per cent | Per cent | Per cent | |
| All | 0.7 | 0.9 | 0.9 | 0.7 | 0.7 | 0.7 |
| Two income household, no children (b) | 0.7 | ** | 1.0 | 0.8 | 0.7 | 0.7 |
| Two income household, with children (b) | 0.7 | ** | 0.8 | 0.8 | 0.7 | 0.7 |
| One income household, no children (b) | 0.7 | ** | 0.8 | 0.7 | 0.7 | 0.6 |
| One income household, with children (b) | 0.7 | ** | 0.8 | 0.8 | 0.7 | 0.7 |
| One income single person household | 0.7 | ** | 0.9 | 0.7 | 0.7 | 0.7 |
| Self-employed household | 0.8 | 0.9 | 0.8 | 0.8 | 0.7 | 0.7 |
| Household with primary income source from Commonwealth allowances (e.g. Newstart Allowance, Youth Allowance) | 0.9 | 0.8 | 0.9 | ** | ** | ** |
| Married pensioner household | 0.9 | 1.0 | 0.8 | ** | ** | ** |
| Single pensioner household | 1.0 | 1.0 | 1.0 | ** | ** | ** |
| Sole parent pensioner household | 1.0 | 1.1 | 1.0 | ** | ** | ** |
| Part-pension and self-funded retiree households | 0.7 | 0.8 | 0.9 | 0.7 | 0.7 | 0.7 |
** indicates the sample size was too small to produce statistically reliable results.
Notes: These estimates assume that the carbon price costs are immediately passed through to consumers; that firms do not change their production processes; and that households do not change their consumption behaviour in response to the scheme. To the extent that households reduce their consumption of goods whose relative prices have risen, and increase their consumption of goods whose relative prices have decreased, the real impact on households would be expected to be lower.
(a) Income quintiles rank households from the lowest 20 per cent of disposable income to the highest 20 per cent. Modified OECD equivalence scales are applied to household disposable incomes to allow for comparisons across households of different sizes and compositions.
(b) Principal source of income is wages and salaries.
Source: Treasury estimates based on PRISMOD.
1 For example, in its household expenditure survey, the Independent Pricing and Regulatory Tribunal of New South Wales (IPART) found that average household demand for electricity fell by around 6 per cent between 2005-06 and 2009-10 for the Sydney metropolitan, Blue Mountains and Illawarra areas (IPART, 2009).
2 Impacts on profits are calculated as a net present value of trading profits, calculated from 2013 to 2022 using a real, pre-tax weighted average cost of capital of 9.7 per cent (consistent with the discount rates adopted by SKM MMA and ROAM).
3 The adoption of both conventional and alternative fuels among heavy vehicles takes into account the impact of carbon pricing on the entire production cycle of the fuel.