Key points
International negotiations have resulted in 89 countries making pledges to undertake mitigation action. These countries cover over 80 per cent of global emissions and over 90 per cent of the global economy. These pledges have countries committing to action earlier than Treasury previously modelled in the Carbon Pollution Reduction Scheme (CPRS) scenarios in 2008.
The two global action scenarios incorporate world action to stabilise greenhouse gas concentration levels at around either 550 or 450 parts per million (ppm) by around 2100. They provide a credible and realistic backdrop to examine the introduction of a domestic carbon price.
World carbon prices are expected to range from A$29 to A$61 in 2015-16 (nominal), depending on the degree of international action.
The world continues to prosper while cutting emissions to reduce the risks of dangerous climate change. By 2050, global output is projected to be over 3½ times higher than today even with ambitious cuts in global emissions.
Pricing carbon will drive structural change in the global economy, moving resources and employment towards less emission-intensive industries.
Early global action is cheaper than delayed action. For economies with high levels of carbon pollution per unit of output every year of deferring action on climate change will lead to higher long term costs.
The global modelling is robust to a range of assumptions. Sensitivity analysis shows that the aggregate economic costs are similar across a range of plausible assumptions.
3.1 Description of global action scenarios
Without concerted climate change mitigation policy, increases in global prosperity will be tied to rising global emissions, which are projected to be over double what they are today by 2050.1 Current scientific advice is that the implications of such a rise in global emissions would result in catastrophic changes to the world's environment.
Since the 2008 Treasury modelling, international negotiations have resulted in 89 countries making pledges to undertake mitigation action. These countries cover over 80 per cent of global emissions and over 90 per cent of the global economy. These pledges suggest international mitigation effort has been brought forward, compared to what Treasury modelled in the CPRS scenarios in 2008.
The global action scenarios project how the world could evolve, given global action to reduce the impacts of dangerous climate change. They incorporate world action to stabilise greenhouse gas concentration levels at around either 550 or 450 parts per million (ppm) respectively by around 2100. They provide a credible and realistic backdrop to examine the introduction of a domestic carbon price.
With and without global action to reduce emissions, global output is expected to continue to grow strongly, if the likely costs from climate change itself are not included. Strong growth is driven by the continued catch-up of lower income economies towards the GDP per person levels enjoyed by high income countries.
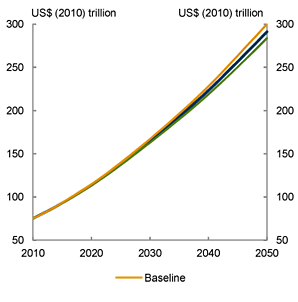
Gross world product (GWP) in the medium global action scenario is projected to rise from $75 trillion in 2010 to $290 trillion in 2050. The projected average annual growth rate in GWP is 3.4 per cent, slightly slower than the 3.9 per cent experienced over the past 50 years. Average annual growth in GWP is expected to be around 4 per cent to 2030, before slowing due to projected changes in demographics.
This strong global outlook contains within it a shift in the source of global growth towards fast growing Asian economies. The Chinese and Indian economies joint share of global output is projected to increase sharply from less than 10 per cent in 1990 to 25 per cent of global output by the end of this decade and to around a third by 2030. China's GDP is projected to overtake that of the US in 2018 and India is projected to overtake the US after 2039.
The productivity catch-up occurring in these and other countries will result in an increase in the income of billions of people. By 2050, China's GDP per person is expected be over six times the current level and India's GDP per person over nine times the current level.
This analysis does not include the economic impacts of rising global emissions. To form policy judgements, this modelling analysis needs to be evaluated alongside the detailed analysis of the economic and social impacts of climate change itself and the benefits of reducing global emissions.
Box 3.1: Climate change projections: stabilisation at 450 and 550 ppm
Climate change could severely affect Australian agriculture, infrastructure, biodiversity and ecosystems (Garnaut, 2008). Australia's hot and dry climate and economic structure make Australia particularly vulnerable to climate change (Pearman, 2008; Garnaut, 2008; and Garnaut, 2011). For example, more than $226 billion in commercial, industrial, road and rail, and residential assets is potentially exposed to inundation and erosion hazards at a sea level rise of 1.1 metres in the high end scenario for 2100 (DCCEE, 2011).
The global average surface temperature has risen around 0.8 degrees Celsius since 1850. It will rise further in the coming decades as a result of emissions that have already occurred, based on current scientific studies. Without further mitigation, atmospheric concentration is projected to rise to around 1500 ppm by around 2100. This has a 50 per cent chance of a temperature increase of 7 degrees above pre-industrial levels, leading to catastrophic consequences for the world.
Avoiding these consequences will require atmospheric concentrations being stabilised at a substantially lower level, requiring significant cuts in global greenhouse gas emissions. Lower stabilisation levels require global emissions to peak within the coming decade and fall well below current levels by 2050 (IPCC, 2007a).
Stabilisation at 450 ppm CO2-e leaves a 50 per cent chance of limiting global average warming to around 2 degrees Celsius above pre-industrial levels. This temperature threshold is frequently referred to in the scientific literature as representing the limit beyond which 'dangerous' climate change may occur (for example, Hansen et al., 2007).
Stabilisation at 550 ppm CO2-e leaves a 50 per cent chance of limiting global average warming to around 3 degrees Celsius above pre-industrial levels — 20 to 30 per cent of all species are projected to face a 50 per cent likelihood of extinction under this scenario (IPCC, 2007b), involving total realignment of ecosystems across Australia. Coastal communities, agriculture and infrastructure would all face significant risks, including frequent or permanent coastal inundation for parts of the Australian coastline, a substantial increase in extreme weather across the nation, and substantial restructuring of the rural sector (Pearman, 2008).
3.1.2 International action
At the December 2010 United Nations Climate Conference in Cancun, developed and developing countries pledged side-by-side to reduce or limit their national emissions under the United Nations Framework Convention on Climate Change. Now 89 countries have pledged action. These countries cover over 80 per cent of global emissions and over 90 per cent of the global economy (World Resource Institute, 2011; IMF, 2010). There was broad international agreement to limit the global temperature increase to less than 2 degrees Celsius.
Given this international backdrop, two global action scenarios have been modelled that allow for gradual but effective mitigation. Low-end 2020 pledges made under the United Nations Framework Convention on Climate Change serve as the basis for the medium global action scenario's allocations to 2020. The high-end pledges, with more stringent reductions for some regions at 2020, are the basis for the ambitious action scenario.
Table 3.1: Summary of international global action scenario assumptions
| Medium global action scenario | Ambitious global action scenario |
|---|---|
| Stabilises concentrations of greenhouse gases at 550 ppm CO2-e by around 2100. | Stabilises concentrations of greenhouse gases at 450 ppm CO2-e just beyond 2100. |
| Incorporates the low end pledges under the Cancun Agreements until 2020(a). | Incorporates the high end pledges under the Cancun Agreement to 2015-16. After 2016, major advanced economies increase their effort above the pledge levels. |
| Multistage action: developed countries and China lead the mitigation effort initially; all countries act by 2031. | Multistage action: developed countries and China lead the mitigation effort initially; all countries act by 2026. |
| Mechanism: from 2013 to 2015 uncoordinated global action, no trade in permits, differentiated carbon prices. From 2016 onwards, countries trade, either bilaterally or through a central market. | |
| Coverage: all sectors are covered from the start, except agriculture, which is covered from 2031. | |
| Technology: nuclear is only considered a technology option in countries that have current nuclear generation(b). | |
Note: (a) Where a whole region does not have a pledge (such as OPEC), the 2020 allocation is set equal to baseline emissions. Where a region includes a number of countries with 2020 pledges, regional allocations have been estimated, weighted by individual countries' share of total regional emissions in 2005 (CAIT, 2005), with those countries in the region without pledges getting allocations equal to baseline emissions; (b) Sensitivity analysis explores the effect of a worldwide freeze on nuclear generation capacity.
After 2020, allocations are based on a multistage allocation rule similar to the CPRS scenarios in the previous Treasury modelling, adjusted to reflect existing 2020 pledges. Under the multistage approach, regions make equal percentage reductions from baseline, with a five or ten year lag for some developing regions.
In the medium action scenario, developed regions, China, OPEC and South Africa enter the multistage approach from 2021. India, Indonesia and Other South and East Asia enter in 2026. The Rest of World region enters in 2031. In the ambitious action scenario, the lag between different regions is compressed, with all regions except Rest of World entering in 2021 and Rest of World entering in 2026.
The transition from a region's pledge level at 2020 to the multistage allocation level in 2040 is linear. Thus, the stringency of the allocations between 2020 and 2040 depends on the region's pledged 2020 target, when it enters the multistage allocation rule as well as baseline emissions.
Table 3.2: Regional emission allocations2
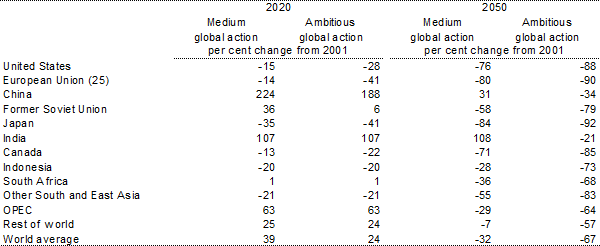
Source: Treasury estimates from GTEM. Note: all years in this publication, unless otherwise indicated, are Australian financial years, ending 30 June of the year quoted.
Regions are assumed to meet their targets from domestic sources only during the uncoordinated transition from 2013 to 2015. Global coordinated action emerges from 2016. This results in regions being able to source abatement from each other, minimising their mitigation costs.
A country will source abatement from others if this provides a cheaper option than reducing emissions found domestically. Similarly, a country will supply abatement to others to earn income if it is relatively cheaper to reduce emissions. An equilibrium global permit price emerges to clear the global permit market.
Table 3.3: Regional shares of global mitigation, population and GWP in 2050
Per cent of global total
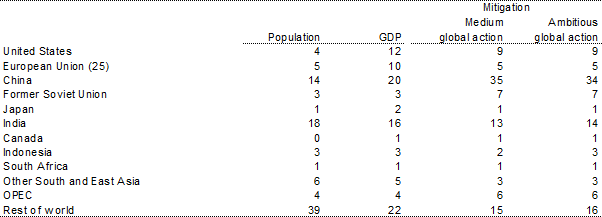
Note: GWP shares are calculated using 2005 purchasing power parity (PPP) weights. GWP shares differ slightly between the action scenarios, for simplicity the average GDP share is shown.
Source: Treasury estimates from GTEM.
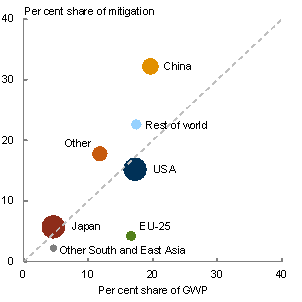
Each region's mitigation effort reflects the allocation methodology assumed, which dictates equal percentage emission reductions from the baseline. The higher a country's baseline emissions, the larger their share of the mitigation effort. China is projected to have strong GDP growth in the baseline, accompanied by increasing emissions, leading to a large share of the global mitigation effort in both global action scenarios. These respective shares of mitigation effort simply reflect projected global economic significance.
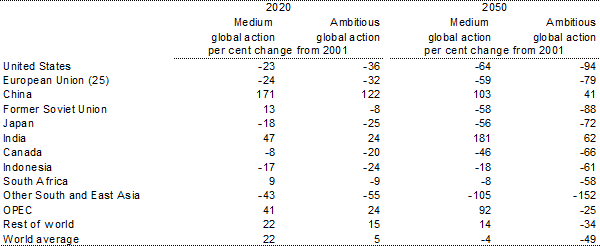
Although China accounts for 34-35 per cent of the global mitigation effort in 2050, its emissions actually continue to grow in both global action scenarios to around 2030, while developed countries' emissions peak by 2015.
Chart 3.1: Regional contribution to mitigation action
Medium global action scenario
2020
2050
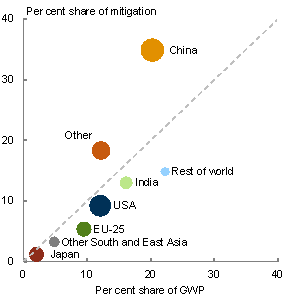
Note: Position of country circles indicates both share of mitigation and share of GWP, with the 45 degree line showing equal proportion over both categories. Circle size indicates the relative mitigation per person for each region. 'Other' includes Former Soviet Union, Canada, Indonesia, South Africa and OPEC. India does not appear on the LHS chart because its emissions mitigation is zero compared to the baseline.
Source: Treasury estimates from GTEM.
The regions above the 45 degree line are those countries with strong emission growth projected in the baseline. Each region's share of GWP relative to their share of mitigation reflects the stylised allocation approach used.
3.1.3 Global emission reductions
Many possible global emissions pathways could achieve a given stabilisation goal. Each pathway implies a different allocation of mitigation effort over time, with implications for economic costs, intergenerational equity and preservation of options to change emission budgets and stabilisation goals in light of future information.
A Hotelling rule is used to construct a global emissions pathway for each scenario within GTEM.3 The carbon price grows from a specified starting level at the real interest rate, assumed to be 4 per cent on average per year, which represents the rate of increase in comparable financial assets. Other recent climate modelling exercises use similar growth rate assumptions.4 The starting carbon price for each scenario is set so that the global emissions give the desired path for the concentrations of the modelled greenhouse gases using the MAGICC model.5
Chart 3.2: Global emission allocations
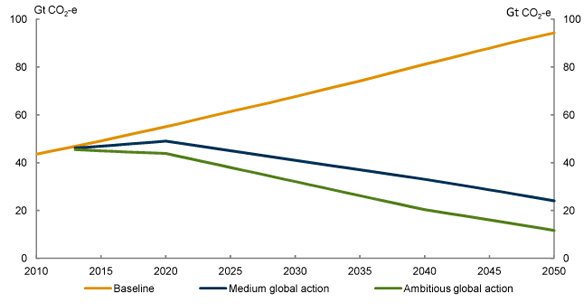
Note: The baseline is a scenario in which no further mitigation occurs. For more information on the baseline see Appendix B.
Source: Treasury estimates from GTEM.
Table 3.4: Global emission allocations (Gt CO2-e)
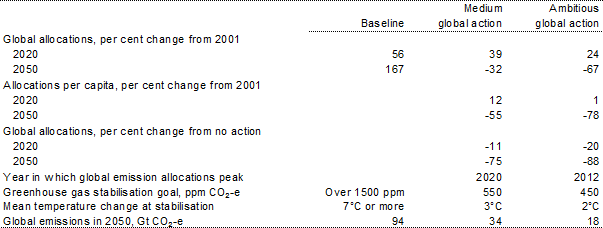
Source: Treasury estimates from GTEM and MAGICC.
Global allocation levels are slightly higher in the initial years than in the previous Treasury modelling, reflecting the uncoordinated global action. In later years the allocation levels are lower.
Reducing emissions from fossil fuel combustion account for most of the mitigation effort to 2050. Global mitigation can be achieved at lowest cost if policy is designed to cover a broad range of emissions. Targeting only CO2 in mitigation efforts would increase the costs of achieving the same environmental goal substantially (OECD, 2009).
Forestry sinks across most regions provide substantial emission sequestration, wholly offsetting non-combustion CO2 emissions from all sources by around 2020. Non-combustion CO2 emissions — including fugitive emissions, waste and emissions associated with land-use change and forestry — are negative for most of the projection period as reafforestation continues.
Current estimates of mitigation potential suggest that reducing methane and nitrous oxide emissions require higher carbon prices than CO2 emissions; consequently, these sources contribute less to global mitigation. In addition, emissions from agriculture are not included in international policy mechanisms until after 2030. As a share of total global emissions, methane increases from 14 per cent now to 16 per cent in 2050;6 nitrous oxide increases from 6 per cent to 11 per cent. Global emissions of the other gases (SF6, HFCs and PFCs) are largely eliminated through changes to industrial processes, and are expected to comprise around 1 per cent of total emissions in 2050.
Chart 3.3: Global mitigation by gas
Medium global action scenario
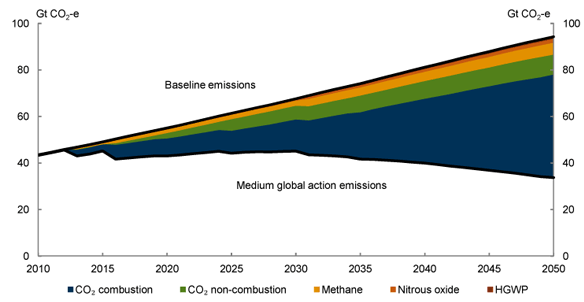
Note: HGWP refers to high global warming potential gases, including SF₆, HFCs and PFCs
Source: Treasury estimates from GTEM.
3.1.4 Global carbon price
In the near term, the modelling assumes countries will meet their Accord targets through existing measures, where possible. For example, the modelling assumes countries and regions with emissions trading schemes already in place continue with their schemes. However, several regions are assumed to take additional individual action from 2013 to meet their 2020 pledges.
Global prices in the early years of the international scenarios (2013 to 2015) reflect uncoordinated global action with countries acting largely in isolation to reduce emissions. Countries and regions face individual carbon prices.
The modelling assumes an eventual shift to a lower cost coordinated international policy framework, recognising that this is ultimately in all countries' best interests. By 2016, a more coordinated international policy regime allows countries to trade either bilaterally or through a common central market. As a result, a harmonised world carbon price emerges in 2016.
Once a common price emerges, the global action scenarios choose the required starting carbon price to achieve the desired greenhouse gas concentration stabilisation level. The global carbon prices for the 450 ppm scenario are more than double those of the medium global action scenario in 2016, US$58 and US$287 respectively.
Chart 3.4: Global carbon prices
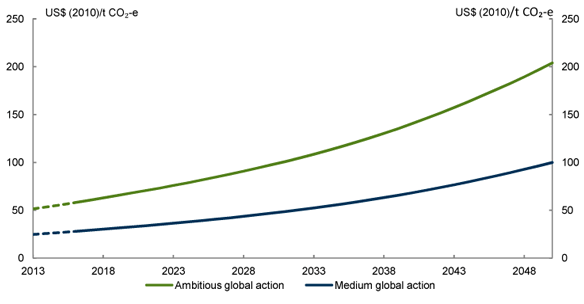
Note: Dotted lines indicate an implied harmonised world carbon price before 2016.
Source: Treasury estimates from GTEM.
World carbon prices are projected to be higher than the previous Treasury modelling for the ambitious global action scenario, but broadly unchanged for the medium action scenario. Delayed and less coordinated international action on climate change pushes up world prices to achieve the same environmental outcome. The global financial crisis delayed emissions growth in developed countries and higher projected energy prices push down world carbon prices. However, emissions growth in developing countries is projected to be stronger, pushing up world carbon price estimates.
Box 3.2: Comparing international carbon prices
The global carbon price varies across markets. The most significant carbon units traded today are European Union Allowance permits (EUAs) and Certified Emission Reductions (CERs). EUAs can be purchased or sold by companies covered by the EU Emissions Trading Scheme to meet their targets. CERs are emission reductions achieved by Clean Development Mechanism (CDM) projects. CERs may be directly used to comply with targets under the Kyoto Protocol or sold through the EU Emissions Trading Scheme.
The spot and futures prices of EUAs and CERs change reflecting expectations about the demand and supply of permits. The spot prices for EUAs have traded between A$16 and A$23 over the past 3 months and the futures prices for December 2014 have traded between A$19 and A$28 over the same period (IntercontinentalExchange, 2011). This is broadly comparable to the implied world carbon prices of around A$24 in 2012-13 (nominal) suggested in the medium global action scenario. Deutsche Bank has also forecast the EUA price to be around A$25/t CO2-e at the end of 2011 (Thomson Reuters, 2011).
Chart 3.5: International carbon prices
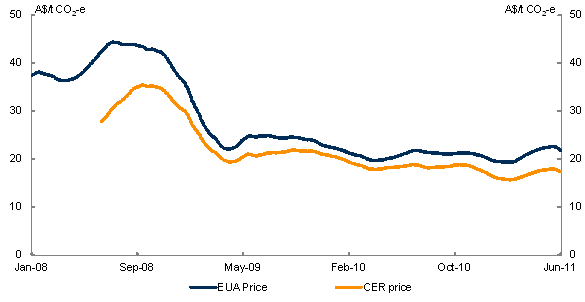
Note: Prices are a 3 month moving average.
Source: IntercontinentalExchange and Reserve Bank of Australia.
3.2 Global results
Pricing carbon decouples the link between global economic and emissions growth. All global action scenarios modelled show robust global economic growth, while emissions are dramatically reduced.
Under both global action scenarios the world economy will continue to prosper, with average annual growth in GWP is around 0.1 of a percentage point slower over the period to 2050. GWP is expected to be more than 3½ times higher than current levels by 2050. This level of GWP is 16 to 29 months behind what it would have been without taking mitigation action.
The broad sectoral trends in the global economy continue as the world acts on climate change. The services sector continues to comprise a growing share of the global economy, and agriculture and energy-intensive industries continue to comprise declining shares. However, reducing emissions requires a shift away from the production of emission-intensive goods towards low-emission goods, combined with a general decline in the emission intensity of production across all sectors.
This analysis does not assess the economic impacts of climate change itself. As a consequence the results presented will understate the net benefit of action. The environmental and economic risks averted by taking action to avoid damaging climate change are substantial.
Chart 3.6: Global emissions and gross world product
Gross world product
Global emissions
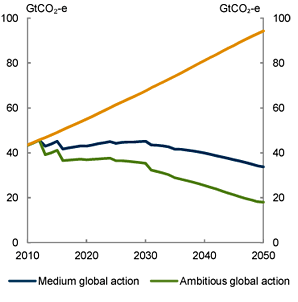
Note: GWP is calculated using 2005 PPP weights. The shifts reflect timing of different mitigation actions and coverage of agriculture. The shift at 2013 reflects the increase in uncoordinated world action; the shift at 2016 reflects the emerging coordinated world action; and the shift in 2031 reflects the expansion of global mitigation policy to agriculture emissions.
Source: Treasury estimates from GTEM.
Total global mitigation costs vary depending on the nature, horizon and stringency of the global stabilisation target, and the policies used to reach it. The global environmental objective is a key to determining carbon prices and aggregate global costs. Lower stabilisation levels, which reduce the risks of dangerous climate change, generally increase mitigation costs.
The reduction in emissions steepens over time and additional resource costs reduce as the structure of the economy shifts and new technologies are adopted. The global cost of being on the ambitious 450 ppm stabilisation path is around 110 per cent greater than being on the medium global action 550 ppm path by 2020. However, the cost difference narrows to around 80 per cent by 2050.
Table 3.5: Global headline indicators
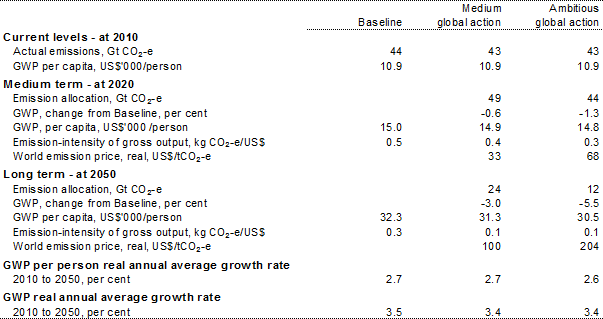
Note: Dollar values are in $US 2010. GWP is calculated using 2005 PPP weights.
Source: Treasury estimates from GTEM.
Box 3.3: Comparison with other international modelling studies
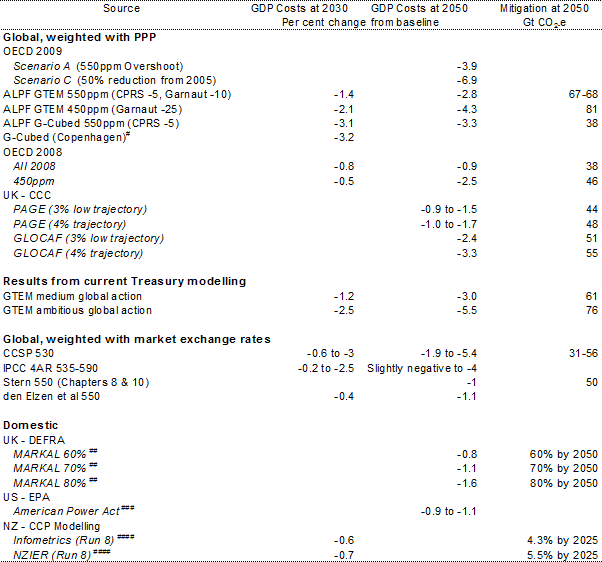
The modelling results presented in this report are compared with other relevant international modelling studies. Comparing results across different models is not straightforward, as there are differences in model structures, input assumptions — including macroeconomic assumptions and model parameter values, details of aggregation and the ways in which a policy is modelled.
These differences need to be considered in interpreting the results across studies. However, most scenarios show that the costs of mitigation, when approached through a broad market-based mechanism, are modest.
Table 3.6: Comparison of modelling reports
# Decline at 2020.
## Reduction on 2000 emission level.
### Reduction in household consumption relative to no action.
#### Decline at 2025.
Note: All GWP costs are percentage point deviations from each study's respective baseline.
Source: Treasury estimates from GTEM and G Cubed; CCC, 2008; CCSP, 2007; DEFRA, 2007; den Elzen et al, 2007; EPA, 2010; IPCC, 2007; McKibbin et al, 2010; NZIER & Infometrics, 2009; OECD, 2008; OECD, 2009; Stern, 2007.
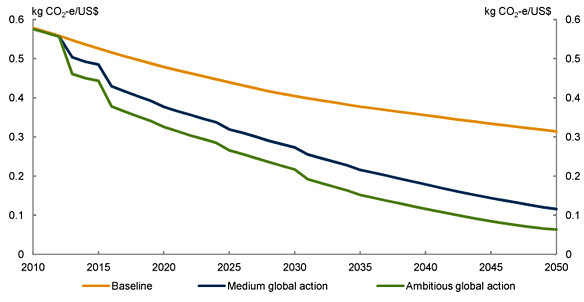
Chart 3.7: Global emission intensity of gross world product
Source: Treasury estimates from GTEM.
The emission intensity of GWP falls in response to carbon pricing, allowing strong growth to continue as emissions fall. The emission intensity of GWP declines from 0.58 kg of CO2-e per US$ in 2010 to less than 0.12 kg of CO2-e per US$ in 2050 under both global action scenarios. The decline in emission intensity increases as the carbon price grows.
Costs of delaying global action
In the medium global action scenario, regions have differentiated carbon prices between 2013 and 2015 with emission reductions on the pathways to meet their pledged 2020 targets. From 2016, global actions are coordinated with a uniform global carbon price emerging across all regions to meet the 550 ppm concentration stabilisation target.
If the world were to act in a more coordinated way from 2013 there is a direct economic benefit. Moving coordinated action forward 3 years would reduce mitigation costs by 2 per cent in 2050.
Conversely, delaying global mitigation action increases climate change risks, locks in more emission-intensive industry and infrastructure, and defers cost reductions in low-emission technology. This will increase the cost of achieving a given environmental goal. The costs of global delay have gone up since the previous Treasury modelling.
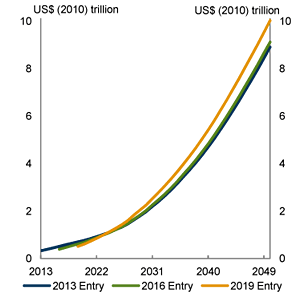
Sensitivity analysis examines the effect of delaying global mitigation action by 3 and 6 years, but still stabilising global greenhouse gas concentration levels at around 550 ppm. Delay brings initial benefits when emissions are not priced. However, GWP levels end up lower than they would have been under early action. And, the more delay there is, the higher the eventual economic cost of achieving the same environmental outcome.
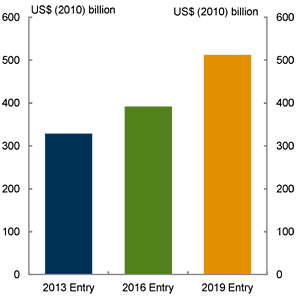
Delaying global action by 3 years adds around 20 per cent to the first year entry mitigation cost; a further three years adds a further 30 per cent to the first year mitigation cost.
Chart 3.8: Costs of delayed global action
First year entry costs
Yearly costs
Source: Treasury estimates from GTEM.
A delayed shift to less emission-intensive technologies and infrastructure will have higher economic cost in the long term.
Sensitivity analysis estimated the costs to late movers. Depending on countries' emission reduction targets and the ability to source permits from other countries, a 3-year delay of mitigation action results in higher mitigation costs of 2 to 10 per cent in 2050.8 The range of costs reflects alternative emission targets of each country, but no matter what the target assumed, delayed action leads to higher eventual mitigation costs.
3.2.2 Regional mitigation costs
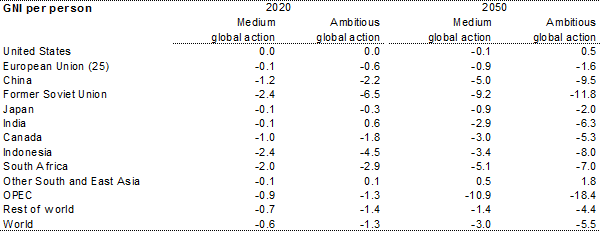
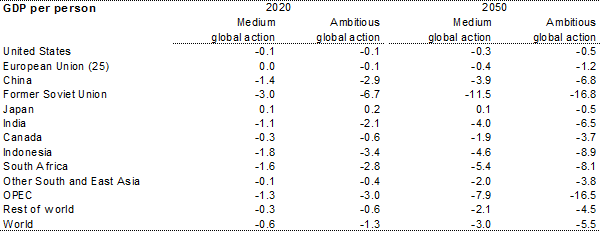
Mitigation costs vary between regions and countries depending on the emission intensity of the economy and its ability to respond with mitigation. Some regions' gross national income (GNI) may improve relative to no action if they are able to sell abatement to other countries. Income from selling abatement depends on the allocation of emissions rights across countries, abatement opportunities and the ability to adopt clean energy technologies.
Table 3.7: Regional GDP and GNI per person costs
Per cent change from baseline
Source: Treasury estimates from GTEM.
Pricing carbon tends to reduce GDP relative to no action more in developing economies, compared with developed economies, as developing economies tend to have a higher emission intensity of economic output. Agriculture, natural resource extraction and manufacturing are all relatively emission intensive and account for a higher share of activity in developing economies. A given amount of mitigation affects GDP more when the emission intensity of output is higher, as it leads to a greater reallocation of resources and more negatively affects capital rates of return and foreign investment. The United States, Japan and the European Union experience the smallest GDP reductions as their economies are relatively low-emission intensive with a large services sector share of the economy.
How emission intensity of output falls in response to carbon pricing varies across regions. In most cases, emission intensity falls more in economies with a low marginal cost of mitigation as they undertake a greater proportion of mitigation in a global trading environment.
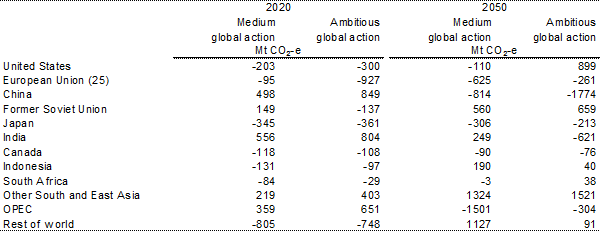
Although developing economies have larger declines in GDP (relative to the baseline) than developed economies, they benefit from income transfers through selling abatement, partially offsetting the negative GDP effects in these regions. Selling abatement helps countries and regions such as India and other South and East Asia.
Income transfers between regions occur because of changes in the terms of trade, the sale of abatement and changes in foreign interest payments. Net income transfers positively affect GNI in regions with low mitigation costs as they can sell abatement. The sale of large amounts of abatement tends to cause the exchange rate to appreciate, positively affecting net foreign interest payments and further boosting net income transfers.
Most developed economies source abatement from overseas, raising their GNI mitigation costs relative to their GDP costs. However, allowing abatement to be sourced from the least-cost location results in lower economic costs for both developed and developing economies.
Table 3.8: Net transfer of abatement
Note: Positive values represent sales of permits; negative values represent purchases of permits.
Source: Treasury estimates from GTEM.
Table 3.9: Regional emissions
Source: Treasury estimates from GTEM.
Box 3.4: The global carbon market
Access to international mitigation through a market based mechanisms such as international emission trading and the Clean Development Mechanism (CDM) can reduce overall costs of meeting any given target by allowing mitigation to occur where it is cheapest.
The global carbon market has seen robust growth in recent years, increasing in size from US$11 billion in 2005 to US$144 billion in 2009 (World Bank, 2011). The market contracted slightly to US$142 billion in 2010, primarily due to a lack of post Kyoto regulatory clarity. The EU Emissions Trading Scheme (ETS) dominates the global market, making up 84 per cent of the total market in 2010.
Future of the Clean Development Mechanism
The CDM established under the Kyoto Protocol, enables Annex I Parties (developed) to purchase certified emission reductions (CERs) from non-Annex I Parties (developing) and use those offsets against Annex I mitigation commitments for the first commitment period of the Kyoto Protocol (as inscribed in Appendix B of the Protocol).
The first commitment period expires at the end of December 2012. Whether a second commitment period will occur is unclear. However, it is likely that the CDM will continue in some form beyond 2012 as the EU has declared that CERs will be eligible to be used in its ETS up until 2020.
3.2.3 Sectoral analysis
The broad sectoral trends in the global economy continue as the world acts on climate change. The services sector continues to comprise a growing share of the global economy, and agriculture and energy-intensive industries continue to comprise a declining share. However, reducing emissions requires a shift away from the production of emission-intensive goods towards low emission-intensive goods, combined with a general decline in the emission intensity of production across all sectors.
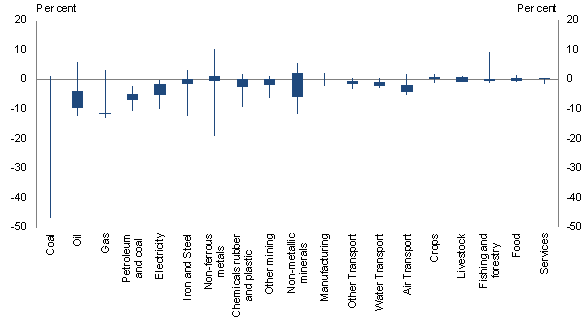
Sectoral output
Global demand for most commodities and services remains strong with action on climate change. While the growth in output of some sectors slows, most emission reductions come from changes in production processes and adoption of new technology.
The effect on output varies across sectors and regions. In some cases acting on climate change causes output growth in the medium global action scenario to increase, reflecting improvements in comparative advantage following carbon pricing. Services are generally less affected than other sectors of the economy, with total global output in the medium global action scenario slowing such that the level is around 1½ per cent lower in 2050 compared to the baseline. Global manufacturing output growth slows slightly compared to the baseline, with India and the former Soviet Union region experiencing the largest declines, reflecting their higher emission intensity.
The growth in the fossil fuel mining sector slows considerably as a result of substitution towards cleaner fuel sources. In 2020, coal mining output is around 30 per cent lower than it would otherwise be, while global oil and gas mining output is 4 to 12 per cent lower than baseline. Electricity generation is less affected, as it switches from fossil fuels to nuclear and renewables.
Over time, development and deployment of technologies significantly affects sectoral growth. For example, the availability of carbon capture and storage technologies reduces the impact of carbon pricing on coal mining. Oil and gas mining, however, continue to slow throughout the projection period to 2050, compared to the baseline. The output of electricity generation rises significantly to be higher in 2050, as continued switching to cleaner technology options enables electricity to become cost competitive against direct use of fossil fuels. This results in considerable substitution towards electricity consumption by energy consumers.
Chart 3.9: Sectoral Output
2020
2050
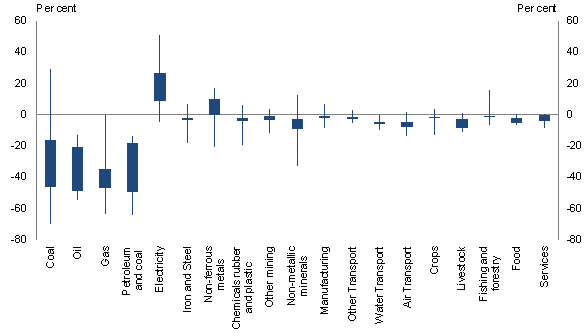
Note: lines indicate the full range of regional output changes relative to the baseline scenario. The bars show the output impact for the central 50 per cent of economies, weighted by their value of output in that sector.
Source: Treasury estimates from GTEM
Sectoral emissions
Mitigation occurs across the economy. In all economies, most emissions come from energy consumption and production. Consequently, mitigation opportunities from energy are important.
Energy emissions can be mitigated through a range of adjustments. Consumers and producers can reduce their demand for energy by substituting other resources for energy, such as capital. Energy sources can shift to emission-free renewables. Technology options, such as drying of coal or carbon capture and storage, reduce emissions from fossil fuels. As the electricity sector reduces its emissions, other sectors, such as transport and industrial processes, plug in to the electricity grid.
Similar adjustment processes are expected for developing economies, where non-energy emissions from agriculture and land use change and forestry play a larger role. While proven low-emission options in agriculture are fewer, they include fertiliser application methods, animal management practices and animal diets. As the agriculture sector is assumed to be excluded from any emission reduction obligations until 2031, these factors are less important. Stopping deforestation is the most important factor for land use change and forestry.
Table 3.10: Global emissions by sector
Change from baseline
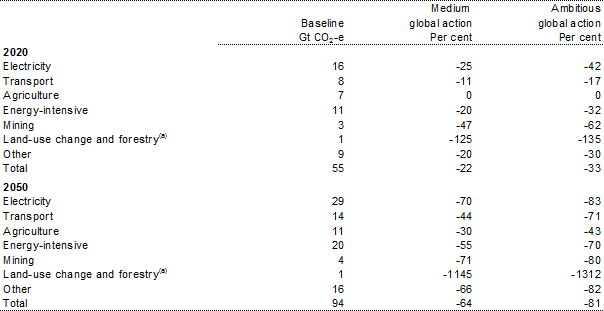
(a) Land use change and forestry per cent changes are large due to small baseline values. Net emissions range from -0.4 to -0.5 Gt CO2-e in 2020 and -5.7 to -6.6 Gt CO2-e in 2050.
Source: Treasury estimates from GTEM.
Electricity generation provides the largest source of mitigation until 2050. Electricity emissions initially decline relative to a world without action, resulting from both declining electricity generation and substitution towards cleaner technologies.
Chart 3.10: Global emission mitigation by sector
Medium global action
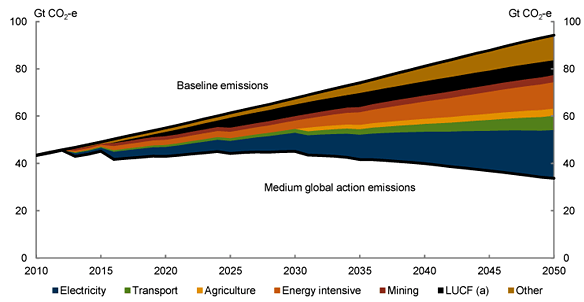
Note: (a) Land use change and forestry.
Source: Treasury estimates from GTEM.
Chart 3.11: Global emission mitigation by sector
Ambitious global action
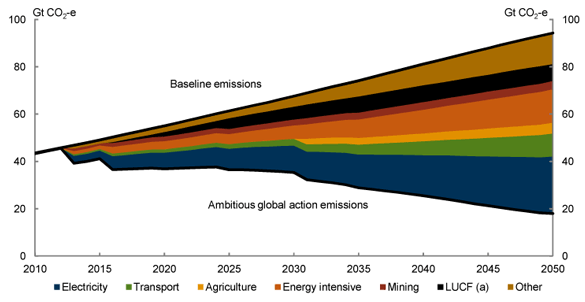
Note: (a) Land use change and forestry.
Source: Treasury estimates from GTEM.
Electricity
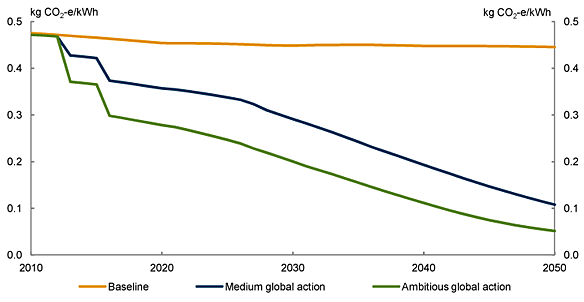
The electricity generation sector is a major source of global emissions (around 30 per cent in 2010), and it provides the largest source of abatement. Initially, pricing carbon leads to a decrease in the demand for electricity. However, as electricity decarbonises, the substitution is back towards electricity as a source of energy, so that by 2050, electricity demand is higher than in the baseline — 23 per cent higher in the medium global action scenario and 48 per cent higher in the ambitious global action scenario.
Chart 3.12: Global emission intensity of electricity generation
Source: Treasury estimates from GTEM.
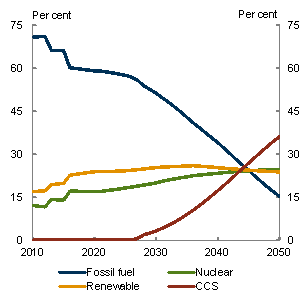
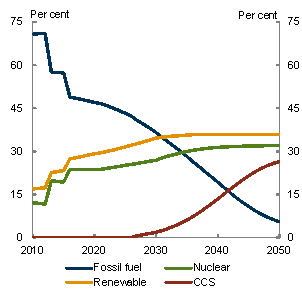
Carbon pricing adds to the cost of fossil fuel fired electricity, making renewable and nuclear technologies more competitive. Shares in low emission technologies rise over time. New technologies, such as carbon capture and storage (CCS) become a large share of electricity generation once they are commercially viable.
In all scenarios, fossil fuels' share falls consistently, with the fall more pronounced under the ambitious action scenario due to higher carbon prices. The reduction in fossil fuel initially is taken up by renewables, particularly wind and nuclear power, which are established zero emission technologies.
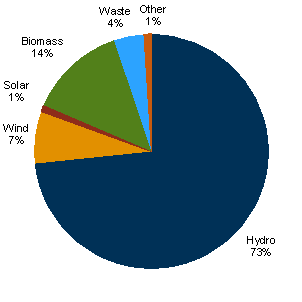
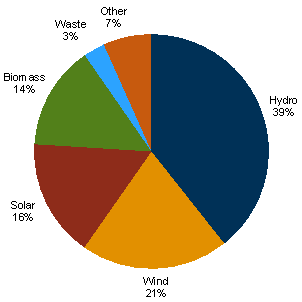
Renewable technologies are projected to make up 24 per cent of the global electricity sector in 2050 (in the medium global action scenario) compared to only 13 per cent in the baseline. Traditional fossil fuel generation (not including CCS) declines from around 59 per cent in 2020 to around 15 per cent in 2050.
Chart 3.13: Global electricity sector technology shares
Medium global action scenario
Ambitious global action scenario
Source: Treasury estimates from GTEM.
CCS provides a potential to reduce emissions from coal and gas generated electricity by up to 90 per cent. This would provide a significant benefit to mitigation efforts. At present, around 30 per cent of emissions come from electricity generation and around 65 per cent of electricity generation comes from coal and gas.
Sensitivity analysis explores the effects of CCS proving commercially unviable. If CCS proves to be unviable global economic costs increase by more than 3 per cent compared to the medium global action scenario in 2050.
Chart 3.14: Renewable electricity generation shares
Medium global action scenario
2020
2050
Source: Treasury estimates from GTEM.
Prediction of commercial viability of clean technologies in the future is difficult. Given recent developments in the nuclear industry in Japan, future expansion in the capacity of nuclear electricity generation has become less certain. Similarly, there is uncertainty over the pace of cost reduction of clean technologies.
Assuming no new nuclear capacity is installed beyond 2020, the modelling shows the global economic cost of achieving the same environmental target is 18 per cent higher than in the medium global action scenario by 2050, as more expensive technologies need to be substituted in order to achieve the targeted emission reductions.
If it was possible to achieve a faster cost reduction in clean technologies through the doubling of the learning-by-doing parameter values, global economic costs could be reduced by 14½ per cent in 2050, compared to the medium global action scenario.9
Transport
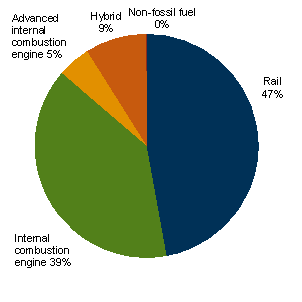
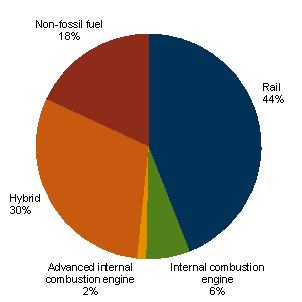
Global transport emissions grow to 2050, as demand strengthens and emission intensity improves only moderately with the uptake of energy-efficient vehicles and hybrids.
Strongest growth in transport emissions occurs where income grows faster, including China, India and the rest of world, which includes other fast growing developing economies.
Mitigation in transport is considerably less than for electricity generation, as fossil fuels remain the primary source of transport fuel to 2050.
Chart 3.15: Global transport technology shares
Medium global action scenario
2020
2050
Source: Treasury estimates from GTEM.
Projections of future commodity prices are inherently uncertain and these have significant bearing on modelling outcomes. To estimate the impacts of commodity prices on the mitigation costs, low and high global oil price path sensitivities have been modelled.
The results show that a 35 per cent lower long-term oil price path raises the global economic cost by more than 3 per cent in 2050. Lower oil prices induce higher emissions, and hence a stronger mitigation effort is needed to achieve the same environmental target.
A higher global oil price path will have different impacts, depending on the extent of the price increase. The results show that increasing the oil price path by approximately 15 per cent reduces the global cost by ½ per cent in 2050; while an increase of approximately 35 per cent increases the global economic cost by 1½ per cent in 2050. To a certain point, higher oil prices curb consumption, which lowers the mitigation effort required to achieve the same environmental target. However, due to the inelastic nature of oil demand, after a threshold is reached, higher oil prices do not induce lower emissions. This makes reaching the same environmental goal harder and requires a greater mitigation effort.
Land use change and forestry
The carbon prices across policy scenarios dramatically reduce deforestation rates, and stimulate large scale reafforestation. Globally, land use change and forestry provide a cumulative net global sink of 130-150 Gt CO2-e from 2013 to 2050. 10 Other South and East Asia and the United States contribute the largest forest sinks across the range of scenarios to 2050.
Other
Agriculture is assumed not to be covered by global mitigation policies until 2031 and emissions continue to grow strongly. The emission intensity of production improves over time, but output grows strongly as living standards in developing economies rise, shifting consumers towards emission-intensive livestock products.
In energy-intensive sectors, mitigation occurs through uptake of low-emission technologies and fuel substitution away from fossil fuels. Global demand for these sectors is largely unchanged with action on climate change.
In both the resource processing and other emission-intensive manufacturing sectors, emissions decline 20 to 38 per cent relative to a world without action in 2020. In 2050, emissions decline by around 46 to 72 per cent in both scenarios.
1 All years in this publication, unless otherwise indicated, are Australian financial years, ending 30 June of the year quoted.
2 For explanation of GTEM regions see Appendix B.
3 For further discussion of the Hotelling rule see Appendix B.
4 For example, see CCSP, 2007, p 89.
5 See chapter 2 for further information.
6 These shares are 1 per cent higher than found in the CPRS-5 scenario, reflecting later inclusion of agriculture (agriculture is included from 2031 in current scenarios, while in the CPRS scenarios it was included from 2015).
7 All international carbon prices are in 2009-10 dollars unless otherwise stated.
8 The costs were estimated based on aggregated GDP for all late movers modelled as a group.
9 Learning-by-doing is implemented by assuming efficiency improvement in labour and capital as the global cumulated output grows.
10 A sink is defined as detracting from, or storing emissions.