Downloads
Thank you for inviting me to speak this important conference.
Today I will talk about:
- the current policy landscape;
- the need for evidence-based policy given this landscape; and
- how we in Treasury use longitudinal data to contribute to evidence-based decision making.
I will then finish by touching on the ways government agencies can encourage evidence-based policy making through open, accessible data sharing.
Policy landscape
Australia's economy has performed remarkably well over the past quarter of a century, in part because of reforms over several decades that have increased flexibility and competition in product and factor markets.
The economy is adjusting to a sequence of large exogenous shocks, any one of which in the past was likely to have caused an outbreak of inflation or even a recession.
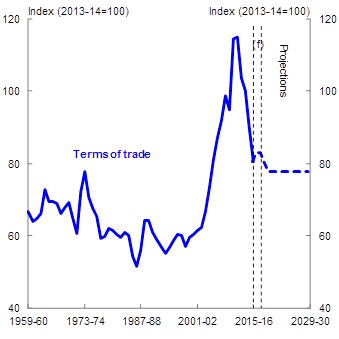
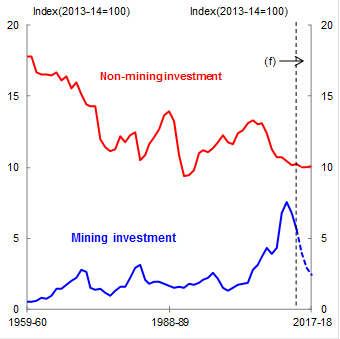
One of these shocks was the boom in demand for commodities, especially iron ore, which led to an unprecedented rise and fall in the terms of trade, and encouraged a significant increase in investment in the mining sector. The relative magnitude of this shock can be seen in the chart. The mining boom has now shifted from an investment phase to production, and this adjustment is being borne out in two interrelated ways: in the adjustment in the real economy as resources investment declines and exports pick up, and in a weakening of national income growth as the terms of trade decline.
Chart 1: The mining investment boom is behind us
 |
 |
Despite this, the economy is growing above potential. Economic growth was 3.3 per cent through the year to the June quarter.1 In line with this, the unemployment rate has fallen by around ½ percentage point over the past year to 5.6 per cent.
From 2017-18, the economy is expected to continue to grow faster than potential, at around 3 per cent, as the output gap is closed. As spare capacity is absorbed, the unemployment rate is projected to converge slowly back to the NAIRU, which we estimate to be around 5 per cent.
Living standards in Australia, as measured by national income, have declined since the peak in the terms of trade in the September quarter of 2011, mirroring the earlier substantial increase to incomes as the terms of trade rose.
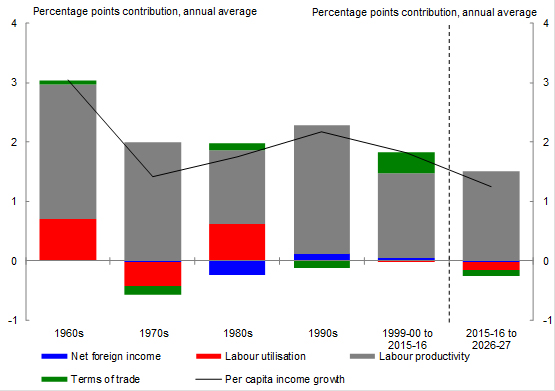
Australia cannot rely on another windfall to incomes like that delivered by the terms of trade boom. As the chart shows, productivity has been the strongest contributor to growth in incomes since the 1960s. Even with the fall in the terms of trade since 2011, the contribution from the terms of trade in the recent period is unprecedented. Productivity growth will need to be higher than the historical average in order to maintain the recent average rate of improvement in living standards.
Chart 2: Contribution to Gross National Income per Person
Productivity has also been growing around its long run average – 1.7 per cent on average each year over the past five years, which is just a touch above the 30-year annual average of 1.6 per cent.
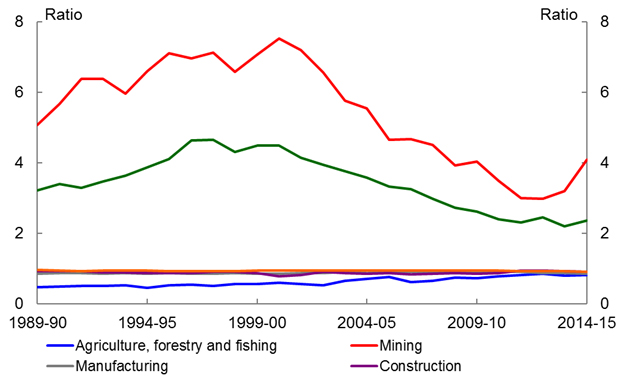
This has primarily been driven by the mining sector, as capacity has come online and output has ramped up. Recently, the mining sector has contributed around half of the economy's labour productivity growth after accounting for the loss of workers to less productive sectors.
Productivity growth in non-mining sectors has been relatively less impressive.
Chart 3: Productivity levels by sector (relative to economy-wide average)
Like future incomes, future GDP growth will be contingent on strong productivity growth.
Last year, we revised down our projection of potential economic growth, from 3 per cent to 2¾ per cent. This revision reflected slower growth in the working-age population and lower contribution of average hours worked to potential GDP.
Like many advanced economies, Australia is dealing with an ageing population. In 1973 there were 7.3 people between 15 and 64 for every person aged 65 and over. Today there are 4.5 people and by 2055 there will be 2.7.2
Population ageing will lower the economy's potential growth rate further but only very gradually, with the potential growth rate reaching 2½ per cent over the next four decades. This adjustment also reflects the fall in the aggregate labour force participation rate resulting from a relatively lower share of people of working age.
Population ageing will bring other challenges too, including increased pressure on government spending which will contribute to a widening fiscal gap.
This underscores the importance of ensuring our budget is in a sustainable position.
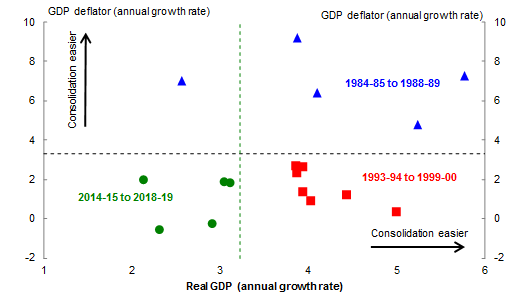
In this fiscal consolidation cycle we have seen slow real growth and low nominal GDP growth, which has weighed on taxation revenue. Real GDP growth during the consolidation in the 1980s was around one and a half percentage points higher than the current period, and inflation3 more than five percentage points higher. During the 1990s consolidation period, while inflation was similar to the current period, real GDP growth was more than one and a half percentage points higher.
Chart 4: Comparison to previous periods of consolidation
The role of evidence-based policy
There is always a premium on strong evidence to support policy change.
The current and prospective fiscal environment only increases this premium.
We need to draw on all available data to improve our understanding of what policy interventions are most likely to achieve the desired level of productivity growth. In an environment of scarce resources, policy interventions more broadly also need to be well directed to achieve the Government's desired outcomes.
Longitudinal data has been an important tool in Treasury's analytical toolkit for many years. I will now share with you some examples of the role of longitudinal data in our analysis of policy options.
How Treasury uses longitudinal data
Use of HILDA Survey Data and longitudinal tax data in Treasury
HILDA Survey data
Longitudinal data, such as the HILDA dataset which you have been discussing here and administrative tax data, is used extensively by our costing and distributional analysis teams. These teams use longitudinal data to build and calibrate microsimulation models to cost first round effects of policy proposals. These models are used to estimate how policy changes affect the whole population and specific groups, such as single parents or low-income earners.
When we aggregate individual responses together, we can assess how the decisions made by millions of individuals affect aggregate levels of savings and overall retirement income adequacy. This approach can help answer important questions such as:
- are people likely to continue working once they are able to access their superannuation, or
- how do life events such as marriage or having children affect
individual saving and labour supply decisions – not just today but for years in the future.
The microsimulation analysis underpins distributional analysis featured in the Budget and other policy documents, capturing the immediate and various impacts of new policies on individuals and households with different levels of incomes and household structures. For example, we can cost changes to Youth Allowance payments because we can estimate the number of individuals who are considered independent based on their workforce participation.
- Another example: our costing team drew on the longitudinal nature of administrative tax data to cost components of the recent superannuation reform package, such as the concessional cap carry forward and the change to the non-concessional contributions cap.
We are developing an overlapping generations (OLG) model to assess better second round effects of policy proposals. It will provide us with a better understanding of who is affected by a policy change, and how those impacts change over time. OLG models are used to model lifecycle events. This will assist us answer questions such as how education influences participation and unemployment today, and how that response changes over the lifetime. More broadly, this model can be used for intergenerational, tax and transfer and fiscal analysis. We will be using HILDA data along with data from other sources to calibrate the OLG model.
We have also used HILDA data in empirical econometric research.
For example, we have published research on the relationship between the cost of childcare and labour supply to answer questions such as:
- how an increase in the price of childcare affects the hours worked by a partnered woman, and
- whether this response differs depending on wages, income and education levels.4
- The Productivity Commission, themselves great users of longitudinal data, used the elasticities generated in this work in their analysis for their inquiry into Childcare and Early Childhood Learning5.
Other empirical research published by Treasury examines differences in unemployment rates by educational attainment. The study used HILDA data to examine skill acquisition dynamics and employment prospects.6 It concluded that the large relative differences in unemployment and labour force participation rates for different levels of education provides strong evidence of the positive effects of improving educational outcomes.
Other longitudinal data
Apart from HILDA and longitudinal personal income tax data, we also use a longitudinal company tax dataset to inform government tax proposals. The dataset contains de-identified administrative data reaching back over two decades. This is useful for looking at company behaviour over time: for example, when companies purchase capital assets or what causes them to fall into loss, the extent to which businesses carry forward losses; and how long it takes for those losses to be utilised. We can also use the data to understand better specific business types, for example, how often small business owners sell their business and when.
Recently, we provided estimates on the cost of the Government's innovation proposal to provide tax incentives for angel investors. This measure was designed to address the difficulties small, early-stage Australian companies face in attracting investment. The dataset allowed us to tap into the behaviour of start-up companies over time which helped us understand the likely impact of this measure.
We are also currently undertaking exploratory work using the Business Longitudinal Analysis Data Environment - a longitudinal census of firm activity brought together by the ABS and the Industry Department. The dataset integrates firm-level data from administrative sources, ABS surveys and business activity data across time to allow a level of analysis that has not been possible before. This exciting new work will also allow us to develop our understanding of the role of competition in driving productivity across sectors of the economy, drivers of small business performance and the role of government regulation on entry and exit in the marketplace.
Outside of Treasury, our colleagues at the Reserve Bank have recently undertaken analysis on the cash flow channel of monetary policy, again drawing on HILDA data.7 I understand this work was presented yesterday by Dr La Cava. Household-level data provide evidence that the household cash flow channel is important in affecting household spending when interest rates move. For those not fortunate enough to have attended Dr La Cava's presentation yesterday, the research finds that the "borrower" cash flow channel is a stronger channel of monetary transmission than the "lender" channel when interest rates move. That is, lower interest rates will increase household cash flow and lead to higher aggregate spending.
The Reserve Bank has previously used HILDA data to assess the financial resilience of the Australian household sector.8 This is possible because the HILDA survey provides information on the distributions of household debt, assets and income. The research quantifies the household sector's financial resilience to macroeconomic shocks and estimates the banking system's exposure to households that are more likely to default.
And of course longitudinal data is used across the federal public service in many projects, which you will have heard about over the course of this conference.
Internationally, longitudinal research provides significant inputs to evidence-based policy making. In particular, I would like to mention the extensive work by our keynote speaker Professor John Bynner in the use of longitudinal data in life course studies, social exclusion research and research methodology. His work provides valuable insights, particularly on the experiences of young people in a changing economic environment, and the policy implications for education and training – areas which continue to be relevant today.
Some future directions for data
I'd now like to talk briefly about what Treasury and other government organisations can do to support researchers and policy makers to discover and generate policy insights.
Drawing from my colleague David Gruen, I would like to outline two important areas, open data and combining data sources.9
Data should be shared
Firstly, with a close eye to protecting privacy, government data should be shared with researchers, the broader public and other government agencies. Increasing availability of data, combined with the tools to use it, will enhance better information making and policy development and assist in facilitating greater efficiency and innovation in the economy.
Universities and research institutes are in an excellent position to build the evidence base – they have the time, expertise and enthusiasm. But often, these researchers do not have ready access to government data.
There is also strong interest from the broader public in our data. The 2016 GovHack – a government data competition that has its origins here in Canberra – attracted over 3,000 participants across Australia and New Zealand.10
In Australia and internationally, open data policies have progressed markedly over the past 5 years or so. In December 2015, the government released a Public Data Policy Statement which outlined its commitment to:
'optimise the use and reuse of public data and to collaborate with the private and research sectors to extend the value of public data for the benefit of
the Australian public.'
There is still a way to go.
Opening government data is not a costless exercise – there will always be resourcing costs that need to be considered carefully. But more importantly we need to respect and carefully manage any privacy concerns that may arise. It is essential that we secure and maintain the social license needed for this work if we are to improve policy outcomes.
In recent months, we saw public concerns about the decision by the ABS to extend the period it retains names and addresses collected in the Census. We also saw the decryption of service provider ID numbers in the sample of patients and their claims through the Medicare Benefit Schedule published on the data.gov.au website.
The Government has acted quickly to make changes to the Privacy Act, but it is equally important that we are engaged in an ongoing discussion with the community about how we are using their data and the benefits to them of data sharing.
There is also a role for the government in demonstrating leadership in engaging with new data analytical techniques. In Treasury, we are exploring ways to utilise high frequency data to provide more timely information about current economic conditions, and we are considering whether machine learning techniques might be used to complement our current approach to forecasting. Use of big data will be a focus of a modelling conference that we are convening early next year.
Data gains new meaning when it is combined
We can increase the potential of our evidence base by joining separate datasets.
We need only look to New Zealand to see the potential benefits of linked data sets.
The Integrated Data Infrastructure administered by Statistics New Zealand brings together a range of administrative and statistical datasets, including economic, education, justice, health and safety, migration, tenancy, tax and business data.
All IDI data – over 166 billion facts - is anonymised and unique identifiers are encrypted.
The New Zealand IDI is used to support Cabinet submissions as both an evidence base for decisions as well as a tool to measure the outcomes of policy or program interventions.
The IDI is also used to provide information directly to New Zealanders. For example, Careers NZ developed an online tool using information from the IDI which compares the earning and employment outcomes of citizens by subject of degree attained to assist potential students to make an informed choice of tertiary studies and institutions.
The Australian Parliament's Joint Committee of Public Accounts and Audit recently asked the ABS to consider a similar approach in Australia.
But of course this is only one part of the data linking story.
So what can governments keep in mind to support researchers and policymakers to link data together?
Firstly, we can work on clear and consistent definitions. There are at least 11 different definitions of small business used by the Commonwealth across different organisations and programs.11 While there might be good reasons for this from a policy and regulatory perspective, it can frustrate efforts to join data.
Secondly, we can better annotate data so that everyone has the capacity to interpret them and draw conclusions.12
And finally, we can provide data in a useable format that can be read by computers. ASIC has introduced inline XBRL, a human and machine-readable format for reporting by companies. This means that investors and other users of financial reports can read and navigate reports on screen as well as undertake computer-based analysis.13 I'm also pleased to say that Budget documents are available in machine readable form.
These simple ways will reduce time spent on extracting, formatting and inspecting data, and increase the time people spend on putting the data to good use.
Concluding remarks
Our economy has performed remarkably well over many years. Policies that promote productivity and improve our fiscal position are needed now if we are to ensure our future success.
This won't be easy – these policies are difficult to design, evaluate and explain.
Facts, evidence and research can help underpin sound policies that will deliver on these aims, and longitudinal data will continue to perform a crucial role in supporting sound policy development.
Thank you.
1 ABS, Australian National Accounts, cat. no. 5206.0, Jun 2016.
2 Treasury, Intergenerational Report 2015, Commonwealth of Australia, 2015.
3 As measured by the GDP deflator
4 Gong, X., and Breunig R., 'Estimating net child care price elasticities of partnered women with pre-school children using a discrete structural labour supply child care model, Treasury Working Paper, November 2012. See also: Gong, X et al. 'How responsive is female labour supply to child care costs – new Australian estimates', Treasury Working Paper, April 2010.
5 Productivity Commission, Childcare and Early Childhood Learning, Inquiry Report, 31 October 2014.
6 Kennedy, S. Full employment in Australia and the Implications for Policy, A speech to the NSW Economics Society, December 2007.
7 Hughson, H. et al., "The Household Cash Flow Channel of Monetary Policy", Bulletin, September Quarter 2016.
8 Bilston, T. et al. (2015)," Stress Testing the Australian Household Sector using the HILDA Survey", RBA Research Discussion Paper.
9 Gruen. D., (2008), The smarter use of data, Address to the Natstats08 Conference.
10 Lim, M., 'GovHack raises the bar for data', August 2 2016, accessed 9 September 2016, < http://www.innovationaus.com/2016/08/Data-set-go-GovHack-s-new-firsts>
11 Treasury analysis. See also: Productivity Commission, Regulator Engagement with Small Business, Research Report, September 2013, p. 265.
12 Yau, N., 'How to make government data sites better', Flowingdata, accessed 9 September 2016 < http://flowingdata.com/2014/06/10/how-to-make-government-data-sites-better/>
13 Australian Securities & Investments Commission, '15-104MR ASIC introduces format for improved communication of financial information', 6 May 2016, accessed 16 September 2016 <http://asic.gov.au/about-asic/media-centre/find-a-media-release/2015-releases/15-104mr-asic-introduces-format-for-improved-communication-of-financial-information/>