Employment White Paper – incentives for secondary earners and income support recipients [1],[2]
Acknowledgement of Country
I would like to acknowledge the Ngunnawal people, the Traditional Custodians of these lands, and their ongoing connection to Country. I pay my respects to their Elders – past and present – and extend my respect to any First Nations people who are with us today.
I acknowledge the passing of Yunupingu and pay my respects to the Yolngu, the Gumatj clan, and the Yunupingu family. As the Prime Minister said Yunupingu was a leader, a statesman and a great Australian. He leaves a lasting legacy and is in our thoughts today.
Introduction
It is a pleasure to speak at the Treasury’s first Policy Research Conference, which is jointly hosted with the Centre for Social Research and Methods at the Australian National University. It is Treasury’s intention that these conferences will be an opportunity to discuss significant policies with Australia’s top academics.
Given the Australian Government will publish an employment white paper in September this year, it was natural to choose the topic of full employment. These discussions will add to the voices we have been hearing through public submissions and consultations.
The Employment White Paper follows on from the Jobs and Skills Summit by further exploring the macroeconomic framework to promote full employment, productivity growth, and improving women’s workforce participation and equality.
It will also examine the changing structure of the workforce, job security, how Australia uses skills and training to expand job opportunities, and how to support those experiencing disadvantage in the labour market.
The interaction of the tax‑transfer system with employment will be an underlying theme in all these domains and is the area I would like to explore today.
History of employment white papers
White papers are statements of government policy and intent. The 2023 Employment White Paper will be Australia’s third white paper on employment.
The first, titled Full Employment in Australia, was published in 1945. It was conceived and drafted as World War Two was nearing its end and thoughts were turning to post‑war reconstruction.
We know from Nugget Coombs’ writing that Australia’s harsh experience of the depression years — when, at its worst, 1 in 5 workers were unemployed (Figure 1) — informed the drafting of the 1945 white paper. That white paper's vision for full employment in peacetime Australia was also inspired by the levels of employment that were achieved when the nation mobilised to support the war effort.
The 1945 White Paper articulated a vision for a peacetime Australia that maintained wartime employment levels. Keynes’ General Theory of Employment, Interest and Money, published in 1936, heavily influenced the policy prescriptions for maintaining ‘full’ employment, in particular, the power of counter‑cyclical policy to smooth periods of lower private sector demand.
The framework laid out in 1945 was utilised by the Menzies Government in response to the 1951 Korean wool boom. Demand management was used to counter a large shock, although the shock in this case was a large positive price and income shock rather than insufficient aggregate demand.
More recently, the Rudd Government’s response to the GFC and the Morrison Government’s response to the COVID‑19 crisis stand as examples of counter‑cyclical fiscal and monetary policy that successfully countered the prospect of high unemployment. These examples illustrate the primacy of good macroeconomic frameworks, above all other policies, in achieving sustained full employment.
That is not to say that policies aimed at reducing the structural rate of unemployment do not play an important role as well. The next employment white paper — titled Working Nation: The White Paper on employment and growth, was published in 1994 — following a recession in which the unemployment rate had averaged 10 per cent in 1992 and 1993. During this period, the long‑term unemployed represented an increasing proportion of the unemployed cohort and there was concern that the level of structural unemployment had increased. Addressing this was a key objective of Working Nation.
Policy responses included significant reform to income support, as well as to employment services, including initial steps towards the current quasi‑market. These changes created much of the income support system we see today – including removing the dollar‑for‑dollar benefit withdrawal rate in the means test to create incentives to take up part‑time work.
The 2023 Employment White Paper
While the 1945 White Paper was published in the shadow of the Great Depression and World War Two, and the 1994 White Paper was published in the shadow of the worst recession in living memory, the 2023 White Paper will perhaps be remembered for being published in the shadow of the COVID‑19 pandemic.
Figure 1: 120 years of unemployment in Australia
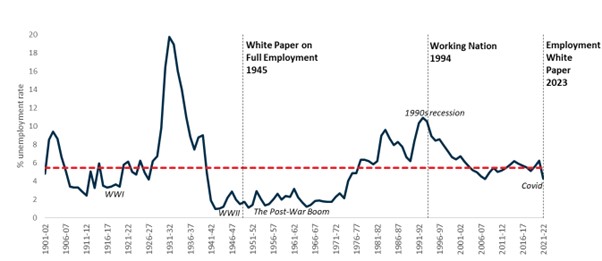
Source: Treasury 2023
The pandemic caused momentous upheaval for all Australians, including a brief recession – the first in 29 years. The effects on the labour market were severe, with around 10 per cent of the labour force losing their jobs or being stood down on zero hours in April 2020. The effective unemployment rate peaked at around 15 per cent in the initial phases of the crisis.[3] However, the effect on the official unemployment rate measure was much reduced due to the impact of policies such as JobKeeper. And reflecting the policy response and easing of restrictions, the economy has since recovered strongly.
As a result, the 2023 Employment White Paper is not being drafted in the wake of mass unemployment. Instead, Australia’s unemployment rate begins with a 3 for the first time since the 1970s. This has created opportunities for many who have previously been unable to obtain work, and for others to increase their hours of work. Many have also been able to find better jobs. But we should not take for granted that these conditions will persist.
The ongoing effects of COVID‑19, high inflation, rising interest rates, global economic uncertainty, and disrupted supply chains compound to challenge Australia’s low unemployment. There are also structural changes, which foreshadow a range of labour market challenges such as flagging productivity growth, technological changes, the transition to low emissions energy, and demographic change.
Nor does our current low rate of unemployment mean we have accomplished all we need to in relation to improving employment outcomes. Structural barriers to employment remain and are experienced unevenly across our society, often rooted in discrimination and disadvantage. First Nations people still have fewer job opportunities than other Australians. Slightly over half working‑age First Nations people (52 per cent) were employed in 2021, compared to three‑quarters (76 per cent) of non‑Indigenous Australians.[4] Similarly, just 53 per cent of working‑age people with disability were employed in 2018, basically unchanged over 15 years.[5]
The barriers framework
Given these challenges, we need to consider how to support more people to obtain work. The White Paper Terms of Reference specifically mention barriers and disincentives to work.
As part of developing the Employment White Paper, Treasury is using a framework to conceptualise the complex and intersecting nature of the barriers to employment, and the systemic inequalities that prevent labour force engagement. This is an adaptation of work done by the OECD to inform policy thinking around employment issues.[6]
Treasury’s adapted OECD framework groups barriers into three categories: ‘job opportunity’, ‘capability’ and ‘incentives’. In other words:
- Are there suitable job opportunities available? This includes considerations such as whether there is sufficient cyclical demand, suitable workplace conditions and hiring practices free of discrimination.
- Does the person have the capability to take them up? This includes vocational barriers such as skills and experience, as well as non‑vocational barriers such as health and access to transport.
- And do they have the right incentives to take on the role?
Each of these categories can be a barrier in and of itself. However, a feature of this framework is recognising how these categories can compound to affect the way people engage with the labour market. Capability barriers, including poor health and limited education, become more difficult to overcome when there are fewer job opportunities.
While opportunity and capability are important, the rest of my remarks will focus on the incentives category of this framework. I will discuss the role of the tax‑transfer system in shaping decisions to participate in the labour market, including decisions about hours of work, focusing on secondary earners and those on income support.
Both secondary earners and those on income support are significantly affected by the tax‑transfer system, although incentive effects differ between the two groups.
Research shows that secondary earners – particularly women caring for younger children – have relatively elastic labour supply, suggesting they are likely to be more responsive to financial incentives.[7], [8], [9], [10], [11]
Research also shows the elasticity of labour supply is higher at the lower end of the income distribution, which is where those on income support are most likely to be.[12] However, it is hard to generalise because income support recipients are a diverse group. Further, there are numerous confounding factors such as mutual obligations and access to concession cards.
Secondary earners
Despite the significant increase in women’s labour force participation since the 1960s, there remain key differences in the ways that women and men participate. These differences become particularly pronounced when families have children.[13] Women often take on the bulk of the responsibility for child caring and housework, reducing their working hours and earnings relative to their partner. This means women are more likely to be the secondary earner.
The financial incentives for a secondary earner to start working (known as the extensive margin), and particularly to take on extra days of work (called the intensive margin), can be dampened by tax‑transfer settings.
This effect is often measured by the workforce disincentive rate. This rate captures the proportion of earnings from an additional day of work that is lost to income taxes, the withdrawal of transfer payments, and net childcare fees. Workforce disincentive rates provide a more realistic idea of the incentives driving work decisions for secondary earners than effective marginal tax rates because household decisions are often made about the number of days to work rather than additional hours.
This chart illustrates workforce disincentive rates for a secondary earner in a couple with three children aged 4, 8 and 10 in 2023‑24.[14] The primary earner receives $60,000 working full‑time while the secondary earner working part‑time receives a full‑time equivalent of $60,000. The rates for the secondary earner in this family exceed 60 per cent when taking up more than one day of work. Further, over 80 per cent of additional earnings are lost on the fifth day of work due to increased income tax and withdrawal of family payments, as well as out‑of‑pocket childcare costs.
Figure 2: Workforce disincentive rates for a secondary earner in a couple with three children aged 4,8 and 10, and $60,000 primary earner income[15]
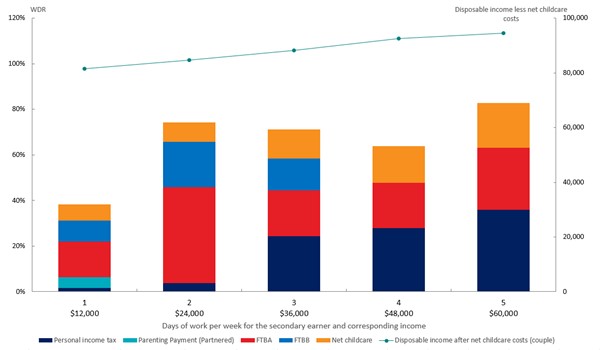
Source: Treasury’s CAPITA model
While employment decisions are complex and clearly encompass non‑financial as well as financial factors, Australian women with dependent children, often secondary earners, are less likely to be in full‑time employment than in comparable countries such as New Zealand, the USA, Canada, and the UK. While Australia’s overall employment rate for women with dependent children is similar to these countries.
Figure 3: Employment rates for mothers with dependent children – international comparison[16]
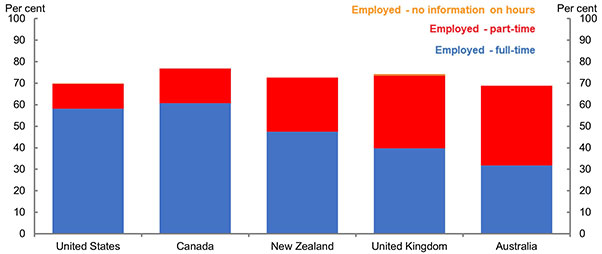
Source: Treasury (2023) analysis of 2019 OECD data
The Government has shown interest in women’s employment outcomes through its changes to the Child Care Subsidy. Treasury modelled the Government’s increase of the Child Care Subsidy to a maximum of 90 per cent in the October 2022–23 Budget and estimated that women with young children could work up to 1.4 million more hours per week in 2023–24 with these reforms, which is the equivalent to adding an extra 37,000 full‑time workers to the economy.
The Government has also commissioned the Productivity Commission to review the child care sector and consider a universal 90 per cent child care subsidy rate, as well as tasking the Australian Competition and Consumer Commission (ACCC) to examine childcare pricing.
Income support recipients
Income support recipients, those people receiving payments such as unemployment benefits and pensions, can also experience work disincentives resulting from the tax‑transfer system. I will focus on the JobSeeker Payment as it is most directly linked to the labour market.
Conversations around JobSeeker often assume that recipients are unemployed. This leads to an analysis of benefit rates relative to the minimum wage. The reality is far more complex. Around one‑quarter of JobSeeker Payment recipients had some form of earnings in the previous fortnight, with many employed in part‑time, entry level jobs. Indeed, reforms like the Working Credit, which allows JobSeeker recipients to accumulate credits while not working that can be drawn down to reduce withdrawal rates when working, have sought to incentivise part‑time work as a stepping stone to full‑time employment and self‑sufficiency.[17]
Given this complexity as people move from unemployment into work, it is useful to think about effective marginal tax rates, or EMTRs, to measure financial disincentives for income support recipients. It is the proportion of each additional dollar earned that is lost through increasing tax and decreasing transfer payments. While conceptually very similar to workforce disincentive rates, EMTRs are more useful for understanding how incentives change as the level of earned income increases.
Income support recipients experience high EMTRs if they earn less than $30,000 per annum – primarily due to the withdrawal of transfer payments as their labour income increases in this range.
This chart shows that a single person on JobSeeker Payment with no children on an annual income of less than $33,000 will generally face an EMTR of more than 60 per cent when working while still receiving payment. At an income of around $33,000 the EMTR falls substantially because the recipient is no longer receiving JobSeeker Payment and hence not subject to the sharp taper rate.
Figure 4: Effective marginal tax rates for a single person on JobSeeker
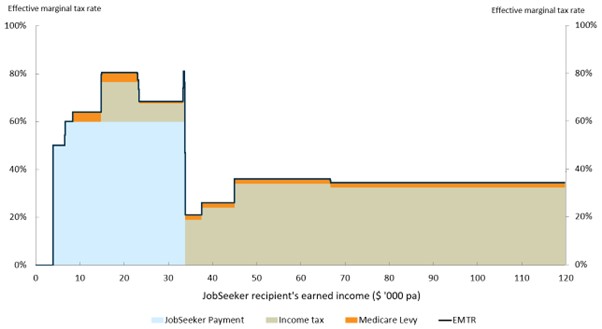
Note: JobSeeker recipient has no children.
Source: Treasury’s CAPITA model
However, many income support recipients who face opportunity or capability barriers to employment will not experience a smooth transition to an income level where they cease receiving payments because they only have the capacity to work part‑time.
Over 2021, around 67 per cent of JobSeeker Payment recipients exited within 12 months (40 per cent within 6 months) but those who remain often face barriers that inhibit their capacity to work full‑time. For example, roughly 43 per cent of JobSeeker Payment recipients have been assessed as having only partial capacity to work, which means they have an impairment that will prevent them from working more than 30 hours per week over the next two years.[18] For an individual on the minimum wage, 30 hours per week, equates to an annual income of around $30,000, which means they are likely to be subject to high EMTRs.
The example I have discussed illustrates the disincentives many income recipients face to increasing their hours of work. It does not say anything about the incentives to work related to, or adequacy of, the level of income support payments. Income support payments are a critical part of Australia’s welfare system and enable people to buy basic goods they need to support job search and participation in the labour market. The adequacy of payments will also vary with individual circumstances. A similar point has been made in discussions about the JobSeeker rate and in submissions to the White Paper. Although the size of these effects is hard to measure, they are important considerations for the design of support payments.
Policy options
If we want to improve incentives for secondary earners and income support recipients then we must navigate the ‘Iron Triangle’ of means testing. This describes the three‑way trade‑off between the adequacy of government payments (including for supporting job search), the costs to taxpayers, and the disincentives for people to get off the payment by earning income.
Transfer payment design
In Australia, incentives and disincentives for secondary earners and income support recipients are most visible through eligibility for and withdrawal of transfer payments. Therefore, increasing work incentives for secondary earners or income support recipients, without reducing the payment level, requires relaxing or removing income‑based means tests.
One option is reducing taper rates. This is the amount a payment is reduced per dollar increase in income.
Another option to increase incentives to work is to increase the amount of credit that income support recipients can accumulate through arrangements like Working Credit, which helps smooth the transition from being on income support to coming off payments. This is particularly important for those working variable hours. The Government has implemented an option like this for Age Pensioners and Veterans Pensioners on a temporary basis until 31 December 2023.
Trade‑offs – fiscal considerations and the role of the tax system
However, as demonstrated by the Iron Triangle, there are trade‑offs with any changes to current settings. Any improvement in transfer payment incentives will ultimately have a budgetary cost if there are no other changes. Given our fiscal challenges over coming decades, any package of changes will need to be revenue‑neutral in the near term and revenue‑positive in the long term.
Revenue raising is not and should not be the only objective of tax reform. Taxes influence behaviour, so it is important that any reform adheres to core tax policy design principles, such as the 2009 Henry Tax Review’s principles of equity, efficiency, and simplicity. This means the tax system should aim to treat individuals with similar economic capacity in the same way, raise and redistribute revenue at the least possible economic cost, and be simple to understand.
Australia’s tax system is not always consistent with these principles. For example, it is easier to reduce tax on income from passive sources than it is for salary and wage income.
There are non‑tax opportunities to make participation incentives clearer to income support recipients and secondary earners which could help drive participation. Key reports such as the McClure Review and Henry Tax Review have found that individuals find it difficult to understand the complex interactions between tax, welfare payments, and additional earnings from work. People are more likely to rely on rules of thumb and put significant weight on losing benefits such as a Health Care Card or social housing. These findings have been reinforced by the stakeholder engagement Treasury has been undertaking for the Employment White Paper.
Conclusion
I have used this speech to highlight one barrier to participation – disincentives to work in current tax‑transfer settings.
Secondary earners face high disincentives to take additional days of work, particularly the fifth day.
Income support recipients face steep disincentives when working part‑time, which permanently reduce the returns to work for those who are unable to work full‑time.
Addressing these work disincentives requires making changes to current tax‑transfer settings, and this will have fiscal consequences in a tight budgetary environment.
Further, for changes to have significant impact, macroeconomic policy must seek to maintain full employment or close to it. In conditions of higher unemployment, secondary earners may struggle to increase their participation, and income support recipients are likely to find it more difficult to get work.
I would like to finish with one obvious point and one point that is often overlooked.
The obvious point is that increasing labour force participation provides financial benefits to workers through wages and to the Commonwealth through additional revenue and reduced welfare costs.
The point often overlooked is that there are health and wellbeing benefits associated with being employed. Research finds there are, for most people, clear physical and mental health benefits. For example, HILDA data shows that working is associated with better mental health and lower rates of psychological distress. We also know that there are strong intergenerational benefits as children with parents who work are more likely to work themselves.
Just as the previous employment white papers made substantial contributions to Australian society, the 2023 Employment White Paper will explore how to extend the benefits of work to people who face barriers to employment.
But it is critical that any future directions consider system simplicity and fiscal responsibility. This is another way the 2023 White Paper will, like its predecessors, be a product of its time.
[1] I would like to express my appreciation to Kurt Nakkan, Michael Bathgate, Elizabeth Baldwin, Alice Shen, Alex Heath, Nick Latimer, Louise Rawlings, Jesse Sondhu, Simon Foat, Myles Burleigh, and Doug Watkins for their assistance preparing this address.
[2] I would also like to thank Professor Jeff Borland for his comments on an earlier version of this address.
[3] https://treasury.gov.au/speech/opening-statement-economics-legislation-committee
[4] 2021 Census.
[5] ABS, Disability, Ageing and Carers, Australia, 2018.
[6] Immervoll et al. 2019.
[7] Breunig et al 2011, ‘Child care availability, quality and affordability: are local problems related to labour supply?’, The Economic Record, Vol. 87, No. 276, pp. 109‑124.
[8] Alexander Bick and Nicola Fuchs‑Schundeln 2017, ‘Quantifying the Disincentive Effects of Joint Taxation on Married Women’s Labor Supply’, American Economic Review, Vol. 107, No. 5, pp. 100–104.
[9] Breunig, Gong and King 2011, ‘Partnered women’s labour supply and child care costs in Australia: measurement error and the child care price’, The Economic Record, Vol. 88, No. 1, pp. 51‑69.
[10] Apps et al. 2012, ‘Labor supply heterogeneity and demand for child care of mothers with young children’, IZA Discussion Papers, No. 7007.
[11] Conventional thinking is that secondary earners have higher labour supply elasticities. However, this has been questioned in some studies – see example Bargain et al. 2013.
[12] Australian Treasury 2007, ‘Australian labour supply elasticities: comparison and critical review’.
[13] Bahar et al. 2022, ‘Children and the gender earnings gap’, Treasury Round Up.
[14] i.e. once the Government’s changes to the Child Care Subsidy come into effect.
[15] Cameo is based on estimated tax and transfer policy settings for the 2023‑24 financial year. Household is assumed to only receive private income from employment. Children under 6 are assumed to be in long day care (LDC) for 10 hours per day worked by the secondary earner, for 50 weeks per year, at a cost of $10.80/hr. Children over 6 are assumed to be in out‑of‑school‑hours care (OSHC) for 4 hours per day, at a cost of $7.85/hr.
[16] OECD 2019, Chart LMF1.2.A Maternal employment rates.
[17] Whiteford 2023, ‘Report to the Robodebt Royal Commission’, https://robodebt.royalcommission.gov.au/publications/professor-peter-whiteford-report-robodebt-royal-commission
[18] Department of Social Services, Expanded DSS Demographic Dataset, December 2022.